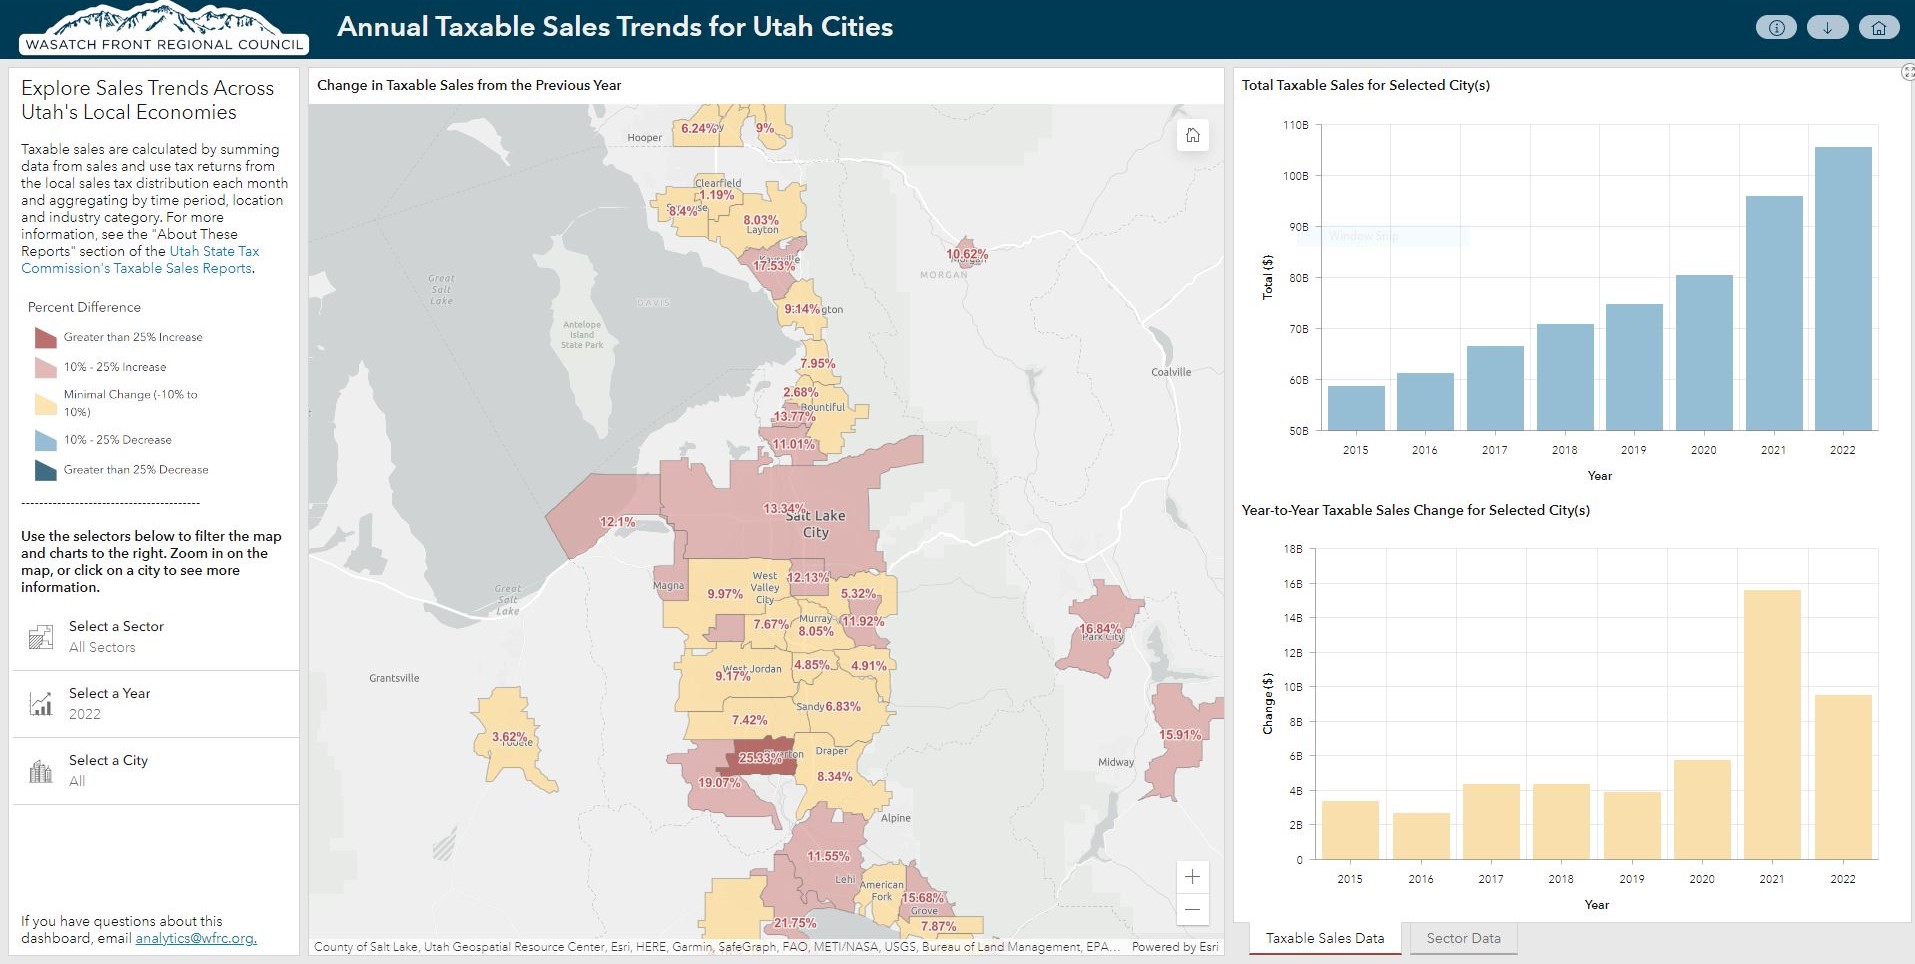
Compare year-to-year taxable sales between 2015 and 2022, using data from the Utah State Tax Commission (USTC), for mid and large-sized cities. This new dashboard is an upgrade to our previous COVID-era taxable sales map, so you can view these trends in a more interactive fashion.
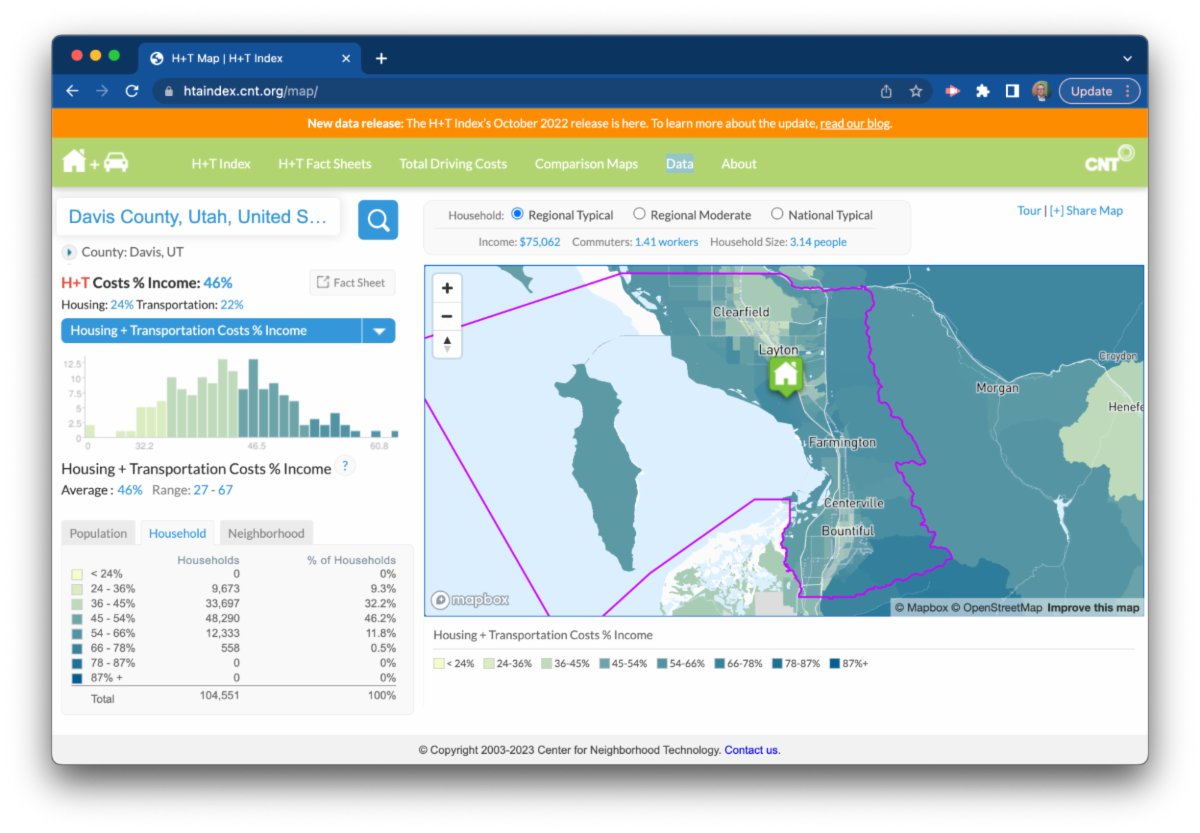
Map of the Month: Household and Jobs Forecast Web Map
Where to call home? In choosing a location to live, cost factors into almost every household’s decision. There’s the cost of owning or renting your home, and the cost–in time and money–of the trips you’ll need to make, some of them nearly every day. Housing and transportation are the two biggest household expense burdens and have a significant impact on a family’s financial outlook. The Wasatch Choice goal “Housing Choices and Affordable Living Expenses” is stated broadly to acknowledge that much more goes into determining affordability than just housing expenses.
The Center for Neighborhood Technology (CNT) maps the average housing plus transportation cost (a.k.a. H + T, for short) at county, city, and neighborhood (census block group) levels. To create the metric displayed in their H + T Index interactive map, CNT leverages census, transportation, employment, and other economic data across each region of the nation.
You can explore the landscape of H + T cost across the Wasatch Front by typing any place name into the search box to quickly get started. But to pique your interest, CNT estimates that H + T is greater than 45% of a family’s budget, for 46.3% of WFRC-area households.
If you want to work with the new 2020 H + T dataset in your own affordability and other analyses, CNT has made their new updated 2020 H + T dataset downloadable at no cost, under a simple data license agreement.
Related Posts