Photo courtesy of Indabelle via Flickr/Creative Commons license.
Wasatch Front Regional Council(WFRC) uses a performance-based planning and programming framework that incorporates federal and regional priorities and objectives. WFRC assesses the status of the Region relative to adopted regional goals, Utah’s Unified Transportation Plan, and Federal performance goals. Analysis is also conducted to understand specific issues relevant to transportation and the interaction with land use and economic development.
Two federal acts – Moving Ahead for Progress in the 21st Century Act (MAP-21) and Fixing America’s Surface Transportation (FAST) – provided a performance management framework for state departments of transportation, transit agencies, and MPOs to assess and monitor the performance of the transportation system. Outlined were seven national performance goals for the Federal-aid highway program and two national performance goals for transit agencies. Each DOT, transit agency, and MPO is required to coordinate together to set performance targets and report on progress toward meeting national goals and agency targets.
Highway Performance Goals
Transit Performance Goals
Safety
Targets are set on a rolling five-year average.
| Performance Measure | Baseline (2016-2020) | Statewide Target (2018-2022) | Actuals (2018-2022) | Target Status |
|---|---|---|---|---|
| Number of fatalities | 267.6 | Less than or equal to 263.6 | 287.0 | Did Not Met |
| Fatality rate per 100 million vehicle miles traveled | 0.851 | Less than or equal to 0.823 | 0.878 | Did Not Met |
| Number of serious injuries | 1,446.0 | Less than or equal to 1,445.2 | 1,540.0 | Did Not Met |
| Serious injury rate per 100 million vehicle miles traveled | 4.596 | Less than or equal to 4.547 | 4.715 | Did Not Met |
| Number of non-motorized fatalities and serious injuries | 216.2 | Less than or equal to 213.8 | 238.2 | Did Not Met |
The safety performance targets support the Highway Safety Improvement Program to achieve a significant reduction in traffic fatalities and serious injuries on all public roads, including non-state-owned public roads.
Safe, user-friendly streets is a goal of the Wasatch Choice Vision and is incorporated into the project selection and project prioritization of the 2023-2050 RTP. It is assumed that any improvement to our streets will improve the safety of the roadway. More than half of the road projects within the 2023-2050 RTP will improve infrastructure with a usRAP rating of less than four (out of five) and have been prioritized with respect to safety. The use of usRAP is consistent with Utah’s HSIP process. The 2023-2050 RTP also includes 25 grade-separated vehicle crossings that will reduce freight conflict with ground transportation, including bicyclists and pedestrians.
Increased use of bicycle and pedestrian facilities is a result of safe, user-friendly streets. The 2023-2050 RTP includes 169 miles of protected and buffered bike lanes and 562 miles of separated, non-motorized shared use paths, side paths, and trails. These facilities provide physical protection in one form or another between bicyclists and vehicles, increasing safety and comfort of the user. In addition, there are 104 enhanced bicycle/pedestrian crossings that will reduce conflict with freight and vehicular transportation and/or will improve safety where potential conflicts between bicycles, pedestrians, and vehicles can occur.
Safety is also a top priority for WFRC’s Transportation Improvement Program (TIP), which seeks to improve regional roadway safety by improving roadways, intersections, and bicycle and pedestrian facilities. In the 2023-2028 TIP, 75 projects totaling $93 million are identified to help achieve progress in the Region’s safety. These projects include grade-separated pedestrian crossings, filling in gaps in the sidewalk network, safe routes to school, intersection signalization, removing obstacles, and realigning intersections.
WFRC is leading a region-wide safety action plan as part of a recently awarded Safe Streets and Roads for All (SS4A) grant. Two principal objectives of the action plan will be 1) to identify strategies and project types to reduce fatalities and serious injuries on roadways in the Region, and 2) to enable communities in the Region to be eligible to apply to the SS4A program in the 2024, 2025, and 2026 cycles. The development of the action plan will be a collaborative effort among WFRC, local governments, UDOT, and UTA, with a focus on applying the Safe Systems Approach, which is a comprehensive look at safety within all aspects of the transportation system. The Action Plan will kick-off in late spring or early summer 2023. The progress in achieving the safety targets is shown above. A target has been met If the actual outcome for a performance measure is equal to or less than the target. Unfortunately, Utah stopped meeting its safety targets in 2020. If a state has not met a target, FHWA will determine if the actual outcome for the target is better than the baseline performance for that target. The baseline performance is the five-year rolling average for the target ending the year prior to the establishment of the state’s target. If a state has not met or made significant progress toward meeting its targets, the state must comply with the provisions set forth in 23 USC 148(i) for the subsequent fiscal year. The state shall:
- Use obligation authority equal to the Highway Safety Improvement Program (HSIP) apportionment for the year prior to the target year, only for HSIP projects.
- Submit an HSIP Implementation Plan that describes actions the state will take to meet or make significant progress toward meeting its targets. The HSIP Implementation Plan should guide the state’s project decisions so that the combined 148(i) provisions lead to the state meeting or making significant progress toward meeting its safety performance targets in subsequent years.
In addition to this directed HSIP funding, UDOT is currently undertaking a Vulnerable Road User Safety Assessment. This federally-mandated, statewide assessment looks at the safety of non-motorists, i.e., pedestrians, cyclists, those using mobility devices, etc. The assessment will identify high-risk areas for non-motorists and a program of projects and/or strategies to be implemented to increase the safety for vulnerable road users. This effort is scheduled to be completed by the fall of 2023. UDOT’s Zero Fatalities Program has been in place for a number of years and focuses on roadway user education. Messaging around driving alert, driving focused, driving calm, driving sober, and buckling up are promoted as safe driving behaviors. These messages are reinforced at the three-day Zero Fatalities Safety Summit. It is held annually with panel discussions, presentations, and workshops, all focused on reducing fatalities and serious injuries on Utah roadways. The Summit includes the one-day Pedestrian Safety Conference, which explicitly brings together diverse individuals focused on the safety of people walking, as pedestrian fatalities and serious injuries make up a disproportionate number of all fatalities and serious injuries that occur on Utah roadways.
Infrastructure
Targets are two- and four-year targets. For the first performance period only, baseline condition and 2-year targets are not required for the Pavements on the Interstate System measures.
| Performance Measure | Baseline (2017) | Statewide Four-Year Target (2021) | Statewide Four-Year Actual (2021) | Full Period Performance Progress |
|---|---|---|---|---|
| Percent of pavement on Interstate System in good condition | 61.9% | >60% | 68.2% | Met |
| Percent of pavement on Interstate System in poor condition | 2.5% | < 5.0% | 0.2% | Met |
| Percent of pavement on non-Interstate System in good condition | 40.6% | > 35.0% | 48.6% | Met |
| Percent of pavement on non-Interstate System in poor condition | 6.0% | < 5.0% | 0.8% | Met |
| Percent of NHS bridges classified as in good condition | 55.0% | > 40.0% | 26.8% | Not Met |
| Percent of NHS bridges classified as in poor condition | 0.7% | < 10.0% | 0.3% | Met |
| Percent of non-NHS bridges classified as in good condition | 47.9% | > 40.0% | 23.5% | Not Met |
| Percent of non-NHS bridges classified as in poor condition | 1.3% | <10.0% | 3.2% | Met |
UDOT, and the state of Utah, prides itself on good asset management. In 2021, Utah received the highest ranking in the nation for infrastructure condition by the White House. Utah has maintained 1 high standards for asset conditions for many years.
Fiscally responsible communities and infrastructure is a goal of the Wasatch Choice Vision, and pavement and bridge conditions have been incorporated into the project selection and project prioritization of the 2023-2050 RTP. Our fiscal analysis has assumed that $9.565 billion will be spent on preservation between 2023-2050 in the two Wasatch Front Urbanized Areas. This is in addition to 2023-2050 RTP roadway capacity projects that will improve pavement and bridge conditions. The WFRC assumes that any roadway widening project will reconstruct the entire roadway.
Also, communities need to build into their maintenance budgets preservation for active transportation facilities such as sidewalks and shared use paths. Many on-street facilities, such as buffered bike lanes, will be considered as part of roadway pavement width maintenance. However, even in those cases, upkeep of painted markings and signage must also be factored into the cost of maintaining good infrastructure.
Asset management is also a top priority for WFRC’s TIP, which implements the short range needs and the maintenance of our existing system and requires jurisdictions to schedule and perform regular maintenance procedures. In the 2023-2028 TIP, 28 projects totaling $94 million are identified to help achieve progress in the Region’s system maintenance. These projects include roadway reconstructions, improving drainage, replacing bridge decks, and other bridge life extension projects.
The IIJA will rebuild roads and includes the single-largest dedicated bridge investment since the construction of the interstate highway system. Based on formula funding alone, Utah is expected to receive approximately $2.4 billion over five years in federal funding for highways and bridges.
WFRC supports UDOT’s pavement and bridge condition targets instead of setting targets specific to the Region. Progress in achieving the four-year infrastructure condition targets is shown above. FHWA determines significant progress for the National Highway Performance Program (NHPP) measures after the mid-point and end of each performance period. FHWA has determined that Utah did not make significant progress for bridges in good condition. Because of that, UDOT is subject to additional reporting requirements.
System Reliability
Reported percentages apply only to the WFRC planning area. For the first performance period only, baseline condition and 2-year targets are not required for the Non-Interstate NHS reliability measure.
| Performance Measure | Baseline (2017) | Four-Year Targets (2021) | Four-Year Actuals (2021) | Full Period Performance Progress |
|---|---|---|---|---|
| Percent of person miles traveled on the Interstate System that are reliable | 90.3% | > 85% | 98.8% | Met |
| Percent of person miles traveled on the non-Interstate National Highway System that are reliable | 83.9% | > 85% | 88.6% | Met |
Travel time reliability measures are the percent of person-miles traveled on the NHS that are reliable, expressed as the level of travel time reliability.
Manageable and reliable traffic conditions is a Wasatch Choice Vision goal. Reliability is directly tied to the congestion of the system, and as such, congestion-related measures are integrated into the performance-based planning of the 2023-2050 RTP. This includes roadway volumes, volume-to-capacity ratios, connectivity, and vehicle hours of delay. The 2023-2050 RTP contains almost 66 miles of managed motorways, including ramp metering and system-to-system metering, on I-15 through Salt Lake, Davis, and Weber Counties to improve reliability of the most-traveled road in the state. The 2023-2050 RTP also contains over 470 miles of operational projects on interstates, freeways, arterials, and collectors to make travel times around the Region more predictable.
Reliability of the transportation system is a core goal of WFRC’s TIP, which adds roadway capacity, intersection improvements, and active transportation facilities across the Region. In the 2023-2028 TIP, 239 projects totaling $441 million are identified to help achieve progress in the Region’s reliability. These projects include intersection improvements, including turning lanes and conversions to roundabouts; installing communication devices, building access management improvements, traffic signal preemption, and grade-separated intersections.
WFRC supports UDOT’s performance targets related to travel time reliability. Progress toward achieving the four-year travel time reliability targets is shown above.
Freight Movement and Economic Vitality
| Performance Measure | Baseline (2017) | Four-Year Targets (2021) | Four-Year Actuals (2021) | Full Period Performance Progress |
|---|---|---|---|---|
| Truck travel time reliability index | 1.21 | 1.30 | 1.04 | Met |
Truck travel time reliability (TTTR) is measured separately for freight on the Interstate System. State DOTs must establish a single index for the Interstate system in the state for five peak-hour travel time periods which include weekday morning, midday, and afternoon periods; weekend periods; and overnight periods.
Access to economic and educational opportunities is a goal of the Wasatch Choice Vision and freight considerations have been incorporated into the project selection and project prioritization of the 2023-2050 RTP, including whether a project is included on the Utah Freight Plan. Projects were evaluated on their ability to enhance freight mobility by considering locations with high truck volume percentages. These projects have allowed freight speeds on critical freight corridors to remain relatively stable, decreasing from 41 miles per hour (mph) today to only 39 mph in 2050. In addition, the 2023-2050 RTP was developed with considerations for freight-oriented developments such as the Inland Port in northwest Salt Lake County, the Business Depot – Ogden, and the Freeport Center in Davis County. Extra freight-planning related outreach to a newly-formed WFRC Freight Advisory Committee and a standalone WFRC Urban Freight Study enhanced freight planning in the 2023-2050 RTP.
The 2023-2028 Transportation Improvement Program includes many projects to help achieve the freight reliability targets, including signal preemption for freight vehicles on three state-owned corridors, improved connectivity in industrial areas, new signals near freight signals, and roadway reconstruction on freight-heavy roads, as well as capacity improvements on major freight corridors.
WFRC supports UDOT’s performance targets related to freight reliability. Progress in achieving the four-year freight reliability target is shown above.
Congestion Reduction
Measure only applies to urbanized areas with a population greater than one million. In Utah, the only urbanized area with a population greater than one million is the Salt Lake City-West Valley City Urbanized Area. For the first performance period only, baseline condition and 2-year targets are not required.
| Performance Measure | Baseline (2017) | Four-Year Targets (2021) | Four-Year Actuals (2021) | Full Period Performance Progress |
|---|---|---|---|---|
| Annual hours of peak-hour excessive delay per capita | 10.6 | 13.0 | 8.8 | Met |
| Percent of non-single-occupant vehicle travel | 24.9% | 24.9% | 26.4 | Met |
The traffic congestion performance measures are applicable to all urbanized areas that include National Highway System mileage, have a population over one million, and are designated as nonattainment or maintenance areas per National Ambient Air Quality Standards. The Salt Lake City-West Valley City Urbanized Area meets the threshold. There are two traffic congestion measures – annual hours of peak hour excessive delay per person and percentage of travel by non-single-occupant-vehicles (SOV).
Congestion reduction performance measures include peak hour excess delay and percent non-SOV. Both manageable and reliable traffic conditions and quality transportation choices are goals of the Wasatch Choice Vision and have been integrated throughout the process to select and phase projects for the 2023-2050 RTP. The 2023-2050 RTP includes a variety of roadway project types, but widening existing roads, constructing new roads to provide greater access and alleviate existing facilities, improving interstate and freeway interchanges, and grade-separating railroad crossings all contribute to reducing congestion in our Region. The 2023-2050 RTP includes 273 miles of roadway widening, 224 miles of new roadway construction, 40 interchange improvements, 19 new interchanges, and 25 grade-separated crossings.
Reducing single-occupancy travel can not only help improve congestion, but can also help improve our Region’s air quality. High-occupancy vehicle (HOV) lanes are mandated by FHWA to have travel speeds greater than general purpose lanes on the interstate during the peak hour, providing an incentive to carpool. The 2023-2050 RTP includes 88 miles of additional HOV lanes. In addition, the roadway project prioritization includes whether projects accommodate transit and active transportation. The 2023-2050 RTP includes over 470 miles of additional transit, and over 1,200 miles of additional active transportation facilities. With the high rate of single-occupancy vehicle travel in the Region, it is safe to conclude anyone traveling by transit, biking, or walking is taking one more car off the road thus improving congestion conditions for those who drive.
Both congestion reduction and providing transportation choices are key elements of WFRC’s TIP, which implements the short range needs and the maintenance of our existing system and requires jurisdictions to schedule and perform regular maintenance procedures. In the 2023-2028 TIP, 239 projects totaling $442 million are identified to help achieve progress in the Region’s congestion reduction. These projects include traffic flow and access management, new capacity, turn lanes, and grade separated intersections. Likewise, the 2023-2028 TIP includes 124 projects totaling $187 million to help achieve progress in providing transportation choices. These projects include bus rapid transit projects, express buses, multimodal hubs, bike share expansion, new bicycle facilities, pedestrian overpasses, and trails.
WFRC agrees with UDOT’s targets for PHED non-SOV travel. Progress in achieving these targets is shown above.
Total Emissions Reduction
| Performance Measure | Baseline (2018) | Targets (2021) | Actuals (2021) | Full Period Performance Progress |
|---|---|---|---|---|
| Carbon monoxide (kg/day) | 83.473 | 156.04 | 196.13 | Met |
| Volatile organic compounds (kg/day) | 4.844 | 5.23 | 11.38 | Met |
| Nitrogen oxide (kg/day) | 37.788 | 9.34 | 55.28 | Met |
| Particulate matter 2.5 (kg/day) | 42.488 | 0.52 | 1.36 | Met |
| Particulate matter 10 (kg/day) | 1.073 | 0.69 | 78.09 | Met |
Targets for the quantifiable pollutants that are reduced through transportation projects funded through the Congestion Mitigation and Air Quality (CMAQ) program are required in nonattainment or maintenance areas for ozone, carbon monoxide, or particulate matter. Performance targets are set for each criteria pollutant.
Targets for the quantifiable pollutants that are reduced through transportation projects funded through the Congestion Mitigation and Air Quality (CMAQ) program are required in nonattainment or maintenance areas for ozone, carbon monoxide, or particulate matter. Performance targets are set for each criteria pollutant.
The Wasatch Front Regional Council planning area encompasses three non-attainment areas: PM10, PM2.5, and ozone. The PM10 non-attainment area is identified as Salt Lake County. The PM2.5 and ozone non-attainment areas are multi-county boundaries, including portions or all of Weber, Davis, Salt Lake, and Tooele Counties, with the addition of Box Elder County in the case of the PM2.5 non-attainment area. The PM10, PM2.5, and ozone non-attainment conditions are mostly due to the formation of secondary pollutants from emissions of VOC and NOx. Therefore, the reduction of these emissions is the primary concern for the Wasatch Front area.
One of the Wasatch Choice Vision goals is clean air and the 2023-2050 RTP strives to improve air quality through a range of multi-modal transportation choices linked to centered development, including new transit options, a wider system of active transportation facilities, and operational improvements to our Region’s roadways.
Emissions reductions of the transportation system is core to WFRC’s TIP, especially the CMAQ program, which identifies projects that improve the quality of life by providing multi-modes of transportation flexibility, access to opportunities, and improved air quality. In the 2023-2028 TIP, 177 projects totaling $281 million are identified to help achieve progress in reducing the Region’s emissions. These projects include bus rapid transit implementation, electrification, bike share expansion, new bike facilities, and a comprehensive travel demand management program.
Progress in achieving the on-road mobile source emissions targets is shown above. WFRC reviewed the above data from the previous four years extracted from the Federal CMAQ Public Access System (PAS). The reported PM10 emission reductions for 2018 and 2019 are exceptionally high relative to the CO reductions. There were some reporting errors identified with earlier projects and WFRC attempted several years ago to correct those in the CMAQ PAS database but it appears some of those errors remain.
Safety
| Performance Measure | Mode | Transit Service Area Target | Reported | Target Status |
|---|---|---|---|---|
| Avoidable accident rate per 100,000 miles | Bus | < 1.0 | 0.68 | Met |
| Reportable accident rate per 100,000 miles | FrontRunner | < 0.5 | 0.72 | Not Met |
| Injuries per 100,000 miles | Bus | < 0.2 | 0.12 | Met |
| Light rail | < 1.1 | 0.43 | Met | |
| Fatalities per 100,000 miles | Bus | 0.0 | 0.0 | Met |
| Light rail | 0.0 | 0.08 | Not Met | |
| FrontRunner | 0.0 | 0.3 | Not Met | |
| Safety events per 100,000 miles | Bus | <0.35 | 0.28 | Met |
| Light rail | <2.5 | 2.49 | Met | |
| Mean distance between major mechanical failures | Bus Fixed + Route Deviation | > 18,000 miles | 19,506 | Met |
| Light rail | > 7,000 miles | 19,543 | Met | |
| FrontRunner | > 14,000 miles | 38,472 | Met | |
| Paratransit | > 23,000 miles | 719,967 | Met | |
| Total employee industrial injuries | All modes | < 0.75 per 100 employees | N/A | N/A |
Through the Public Transportation Agency Safety Plan (PTASP) rule, FTA requires transit agencies to implement a Safety Management System to manage safety risk, which can help agencies maintain or improve their safety performance. Transit agencies are required to develop PTASP that establish performance targets based on the four measures included in FTA’s National Transit Public Safety Plan (NTPSP). The four measures are Fatalities, Injuries, Safety Events, and System Reliability. Transit agencies are required to report their targets and performance to UDOT and WFRC in order to prioritize funding to improve transit safety performance.
WFRC supports UTA’s transit safety targets. Progress toward achieving transit safety targets is shown above. UTA meets all of its bus and paratransit safety targets. Unfortunately, there were two fatalities related to TRAX vehicles and four fatalities related to FrontRunner in 2022.
Transit projects within the 2023-2050 RTP were prioritized based on the walkability and connectivity of the project area, in order to support safe, multi-modal travel. Additionally, it is assumed that future transit projects would be built and operated to include safety features such as well-lit shelters and sidewalk bulb outs and marked pedestrian crossings when applicable. A 2016 study conducted by the American Public Transportation Association (APTA) found that commuters can decrease their risk of being in a travel-related accident by as much as 90 percent by choosing to take transit over driving. The construction and utilization of our transit system therefore, on the whole, contribute to the overall safety of our transportation system. In support of UTA’s PTASP targets, WFRC’s 2023-2028 TIP includes 75 safety projects totaling $93 million identified. Many of these projects are to improve roadways for transit operations or make bicycle and pedestrian connections to transit safer.
In addition, WFRC, in conjunction with transportation partners and local governments, will be pursuing a Federal RAISE grant to fund transportation improvements that reduce barriers for the first-/last-mile to and from transit, Wasatch Choice Vision Centers, and other major destinations. This effort will build on a previous “First-/Last-Mile” TIGER grant from 2016.
State of Good Repair
| Performance Measure | Detail | Mode | Transit Service Area Target | Reported | Target Status |
|---|---|---|---|---|---|
| Rolling Stock | Percent of revenue vehicles that exceeded their Useful Life Benchmark | Articulated bus | 0% | 0% | Met |
| Over-the-road bus | <35% | 31.2% | Met | ||
| Bus | <15% | 13.0% | Met | ||
| Cutaway bus | <15% | 0% | Met | ||
| Light rail vehicle | 0% | 0% | Met | ||
| Commuter rail locomotive | 0% | 0% | Met | ||
| Commuter rail passenger coach | <40% | 30.9% | Met | ||
| Van | <30% | 11.8% | Met | ||
| Facilities | Percent of facilities with a condition rating below 3.0 on the Transit Economic Requirements Model scale | Passenger/parking facilities | <5% | 0% | Met |
| Administrative/maintenance facilities | 0% | 0% | Met | ||
| Infrastructure | Percent of track segments with performance restrictions | Commuter rail | <5% | 18% | Not Met |
| Light rail | <10% | 55% | Not Met | ||
| Streetcar | <10% | 0% | Met | ||
| Equipment | Percent of non-revenue vehicles that exceeded their Useful Life Benchmark | Automobile | <35% | 3.0% | Met |
| Trucks & other rubber tire vehicles | <35% | 66.9% | Not Met | ||
| Steel wheel vehicles | <35% | 100% | Not Met |
Transit asset management develops a framework for transit agencies to monitor and manage public transportation assets, improve safety, and increase reliability and performance to keep their systems operating smoothly and efficiently. UTA is required to coordinate with MPOs to set performance targets to assess the State of Good Repair for four capital asset categories. UTA is then required to develop a Transit Asset Management (TAM) Plan to identify local funding prioritization.
In developing the 2023-2050 RTP, WFRC worked closely with UTA to incorporate state of good repair costs into financial planning. Costs for every transit project included the costs required to keep the project in a state of good repair until the 2023-2050 RTP horizon year.
UTA meets its targets for rolling stock. UTA replaces buses and other revenue vehicles every year on an annual basis. Through the TERM Lite modeling runs, UTA forms their 5-year and 20-year Capital plans which helps forecast upcoming fleet purchases. These forecasts allow UTA to plan for any major upcoming fleet purchases to maintain the desired performance targets. The continued effects of the COVID-19 pandemic and its effects on vendors’ capabilities to meet procurement orders may challenge UTA in making progress toward 2022 targets. The ability to procure new vehicles may be a constraint depending on manufacturers’ capacity to build and deliver vehicles in a timely manner. In addition, UTA is revisiting the current disposal process to find better ways to dispose of retired revenue vehicles in a timelier manner.
UTA meets its targets for facilities. UTA has been able to inspect all facility assets requiring condition assessments. These physical condition assessments will allow UTA to continue to have a more calculated approach to facilities performance targets. Due to the assessment ratings, UTA expects to be able to maintain its target for 2022 at lower numbers. UTA currently has three facility assets falling below a 3 on the TERM scale since implementing the asset management program. All three are parking areas so the risk is minimal. UTA does not anticipate any of its building facilities to drop below a 3 next year. In addition, UTA continues construction on a new bus maintenance campus that will replace its oldest bus campus. The 2023-2028 TIP includes the construction of a new parking structure at the Layton FrontRunner Station.
UTA did not meet two of its targets for infrastructure restrictions. Due to our mountainous area, sometimes erosion, weather, or other issues can result in speed restrictions. However, UTA has recently installed positive train control (PTC) and other rehabilitation projects. UTA has had a couple of years where major rehabilitation projects have been performed. As a result of this, UTA expects its performance restrictions to remain low. The PTC system that had been installed received certification from the Federal Railroad Administration (FRA) in 2020. This implementation of PTC has not created an increase in speed restrictions thus far. UTA sees this as a move in the right direction to keep progress toward lower targets relative to speed restrictions. During 2021, UTA replaced six (6) grade crossing panel sets, one (1) ballasted curve track section, and three (3) embedded curved track sections on its light rail system. The 2023-2050 RTP includes both double-tracking and electrification of the FrontRunner system, which are expected to help reduce restrictions along the corridor. The 2023-2028 TIP includes on-board technology systems to develop and maintain a new controlling data system for route efficiency, vehicle monitoring, and dispatching and transit-signal priority/preemption equipment for additional transit vehicles.
UTA did not meet all of its targets for equipment, primarily due to the number of vehicles purchased as part of UTA’s 2015 rail expansion program. Maintaining funding levels will be critical for UTA replacing end-of-life non-revenue vehicles. UTA prioritizes the rehabilitation and replacement of vehicles providing transit service, so generally its non-revenue vehicles forego replacement when there are significant revenue vehicle capital costs. It is expected that a higher percentage of non-revenue service vehicles will exceed their useful life benchmark as a result. UTA plans to continue to use these vehicles until they are disposed of. As these vehicles age out, UTA will balance the replacement of its critical service vehicles with available funding. In 2020 and 2021, UTA was able to allocate additional resources to the replacement of these vehicles, however, the ability to acquire vehicles was mostly pushed to 2021 and 2022. These additional funding sources will allow UTA to flatten the rate at which vehicles begin to exceed their useful life values.
Performance measures were carefully developed in collaboration with our local communities and transportation partners to give decision makers the opportunity to compare how well the 2023–2050 RTP supports their values and goals. The 2023–2050 RTP was evaluated to determine its social, economic, and environmental impacts and how well it would meet the transportation needs of the Region through the year 2050.
During the development of the 2023-2050 Regional Transportation Plan, project selection criteria was used to evaluate each project and, in conjunction with feedback received from the public involvement process, move towards a preferred scenario.
The WFRC created project selection criteria for roadway, transit, and active transportation projects, in close collaboration with transportation partners and local communities, to craft a preferred regional vision. These methods used the adopted goals, as well as a variety of performance factors, to evaluate which improvements should be included as part of the Wasatch Choice Vision. WFRC crafted the 2023-2050 RTP project selection criteria in partnership with UDOT and UTA, local planners and engineers, the Active Transportation Committee, and the Regional Growth Committee.
Roadways
Read More
- Review feedback from partners, Regional Growth Committee technical advisory committee members, and various stakeholders. Feedback considered information received from External Forces and Policies Peer Groups (2020) and Technical Peer Group (2021); continued coordination with UDOT, UTA, and MAG; comments received from RGC, RGC TACs, and TransCom TACs; comments received from outreach to targeted stakeholder groups; comments from the 2021 RTP Project Cultivation Map; comments received from the WFRC Fall Workshops focused on the Draft External Forces Scenario (Fall 2021) and additional comments received on the Draft Fall 2021 Scenario Map.
- Technical evaluation using measures based on the Wasatch Choice 2050 goals, and influenced by federal goals and performance measures, was conducted.
- Consideration and incorporation of relevant efforts. WFRC’s long-range planning team aims to do the following when selecting roadway projects: ensure relevance of projects with centers and joint corridors with transit and active transportation, ensure alignment of projects with the Transportation Investment Fund and Transportation Improvement Program, and ensure alignment of project if it is part of a major planning study. Other planning efforts such as transportation master plans, which identify regionally significant projects, should be considered in the RTP.
Transit
Read More
- Stakeholder feedback as provided by small area meetings held throughout the Region. This feedback informed staff on which projects support community mobility goals and those that are not needed or desired by the year 2050.
- Technical evaluation for transit line and point projects. Transit projects were run on the travel demand model and compared ridership. Projects were reassigned modes based upon ridership thresholds, along with other relevant criteria screening listed below.
- Consideration and incorporation of relevant efforts such as ensuring alignment with centers and noting corridors with overlapping road and active transportation projects; incorporate findings from other efforts such as Local Link Study, Point of the Mountain, and small area studies; and incorporating alignments and operating characteristics that are defined from existing/ongoing environmental analyses.
Active Transportation
Read MoreAdditional feedback was gathered from local communities and the Regional Growth Committee Technical Advisory Committees during specific comment periods in the Fall of 2021 and Winter of 2022. Community workshops were also held in the Fall of 2021 highlighting the preferred scenario. Over 200 active transportation project comments were received through these efforts. Lastly, several specific feedback sessions were held with UDOT Region 1 and Region 2 planners and UDOT Central Planning to review projects impacting state roads.
The phasing of the 2023-2050 RTP projects was guided by the Wasatch Choice Vision goals. These goals informed the criteria, weighting, and methodology used to phase projects, and differ slightly by transportation mode. WFRC uses a variety of tools to forecast the timing and impact of anticipated growth, such as the regional Travel Demand Model and the Real Estate Market Model. Socioeconomic and travel-related forecasts from these models are used to assign points to each transportation project in the near- and long-term time horizon. Projects are phased using technical data and input from WFRC’s partners, including the Utah Department of Transportation (UDOT), Utah Transit Authority (UTA), and local communities.
The 2023–2050 RTP was evaluated to determine its social, economic, and environmental impacts and how well it would meet the transportation needs of the Region through the year 2050. The goals and objectives for the 2023–2050 RTP helped form the basis for this evaluation. The 2023–2050 RTP was also analyzed with regard to its conformity with state air quality plans and other factors.
Two future scenarios were compared to existing conditions:
- Current path to 2050: this scenario demonstrates how our transportation system and land development patterns will perform together through the year 2050, if we fund and build only the transportation projects using revenue sources currently in place and if we continue existing land use policies through 2050.
- Wasatch Choice Path to 2050: this scenario demonstrates how our transportation system and land development patterns will perform together through the year 2050, if we fund and build transportation projects using revenue sources currently in place along with specific additional revenue streams, coupled with the Wasatch Choice Vision’s proposed land use policies through 2050.
More information about the performance of the 2023-2050 RTP can be found here.
The number of trips per day that residents travel by transit. Public transit is a transportation choice that costs households less to use, improves air quality, and takes cars off of our busy roads.
The percent of people who are nearby (are within one quarter of a mile) a frequent bus routes, transit stop/station, or dedicated bike facility. Multi-modal transportation systems provide transportation choices which may reduce consumer expenses, decrease congestion, or improve air quality.
The total time per day that the average person spends in a vehicle. Auto travel time increases with added congestion and greater distances between homes and jobs. Shorter travel times mean we spend less time driving and have more time for leisure and recreation.
The number of jobs accessible to the average Wasatch Front household. Better access means a bigger labor pool for businesses and opportunities for employment and interaction with friends and family for residents. Access can be increased through transportation improvements, locating development near high-speed transportation, and locating homes near jobs (and vice versa).
The average truck speed on freight corridors in the evening commute. Truck speed is a proxy for the ability of goods and services to reach consumers and the market. Freight movement is a vital part of the State’s economy.
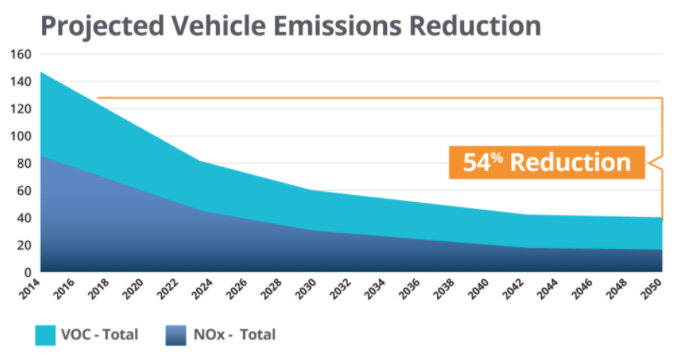
The miles of vehicle travel the Region takes per day per household. With the recent onset of cleaner vehicles and Tier 3 fuels, much of the air quality impact of transportation is from “cold starts” at the beginning of vehicle trips.
The number of miles our Region travels by vehicle per day will increase as more people move to the Wasatch Front. But the number of miles traveled by vehicle per household will decline in the Wasatch Choice path compared to today.
We can make an impact on the number of cold starts in the Region by developing around transit stations and stops, which can make transit more convenient. Also, regional and local policies, such as parking policies, transit fare policies, and other pricing policies can help reduce some unnecessary vehicle trips. Overall, projected vehicle emissions are expected to reduce 54% in the future, mostly due to cleaner vehicle and fuel adoption.
In May 2019, the Wasatch Front Regional Council adopted the Wasatch Choice Vision, a locally driven effort in which cities, counties, community organizations, transportation partners, businesses, the public, and others help to create a blueprint for major transportation investments, as well as land and economic development. The concept of centered development is the key feature of the land use element of Wasatch Choice Vision.
Centers are the hearts of a community, both socially and economically. They vary in scale but in all cases are more intense than their surrounding area; are walkable, often served by a variety of transportation options; and offer a mix of uses including office, dining, retail, and residential. Centers are locations where communities anticipate welcoming more intense buildings, even as they may maintain lower levels of intensity elsewhere. Typically, they are good candidate locations for providing a variety of housing options, including units that impact housing affordability.
The State of the Centers report, first published in September 2019, is an effort to track, record, and communicate metrics that relate to the Region’s shared Vision. Communities can use the State of the Centers report to help determine the extent to which their centers have developed as they envisioned in the Wasatch Choice Vision.
An update to the State of the Centers is currently underway.
Preserving open space is one of the four key strategies of the Wasatch Choice Vision. Easily accessible parks, open spaces, and recreational opportunities are essential to our quality of life.
The counties along the Wasatch Front have the highest rates of population growth in the state. Are cities in this region prepared to balance growth and open space needs? The open space analysis provides data about the current state of open space in Wasatch Front cities and the need for increased open space preservation to balance population growth.
For additional information regarding performance measures, please contact Julie Bjornstad.