SALT LAKE CITY — The Wasatch Front Regional Council (WFRC), in…
Explore Sales Trends Across Utah’s Local Economies
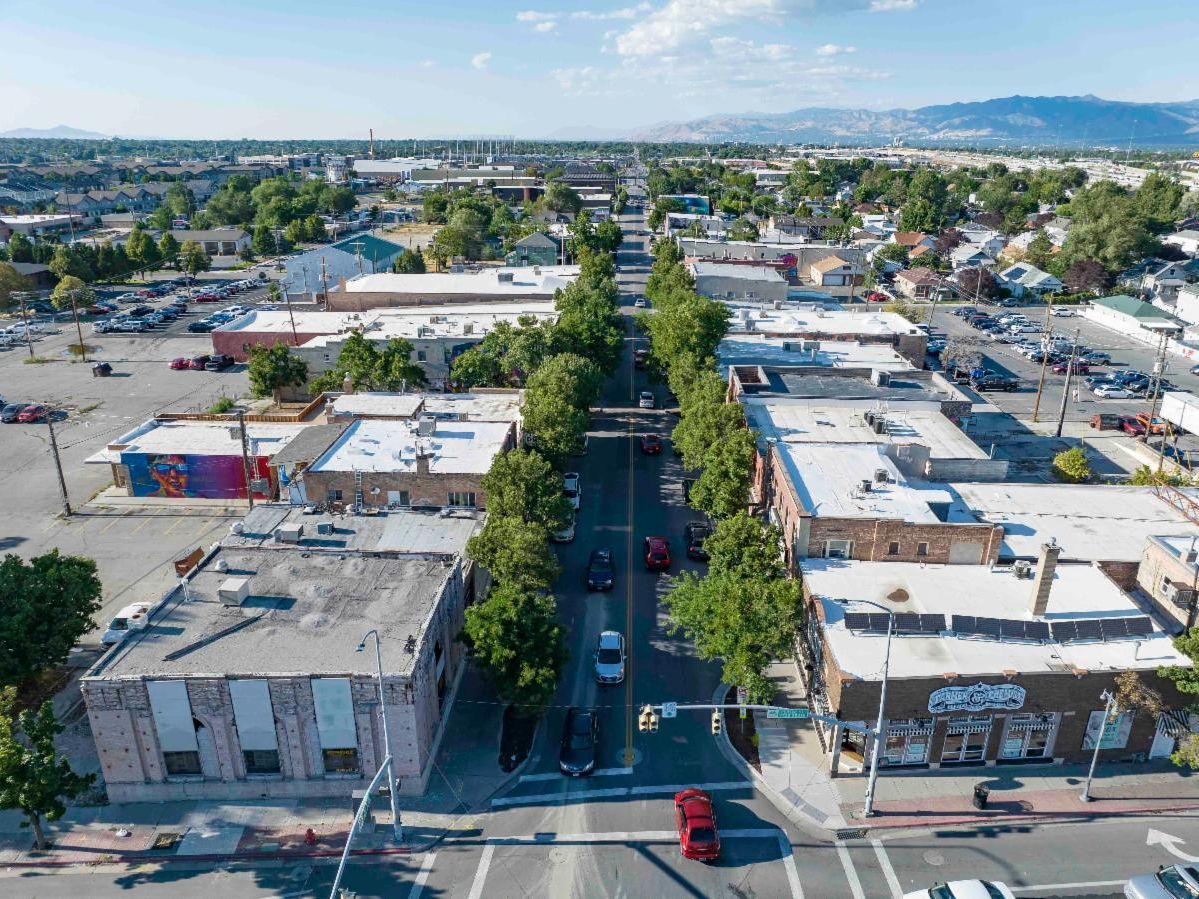
Taxable sales and accompanying sales tax revenues help fund everything from public services to road projects and transit operations. With the worst of the COVID-19 pandemic behind us, local economies and regional taxable sales patterns are moving toward ‘new normal’ levels.
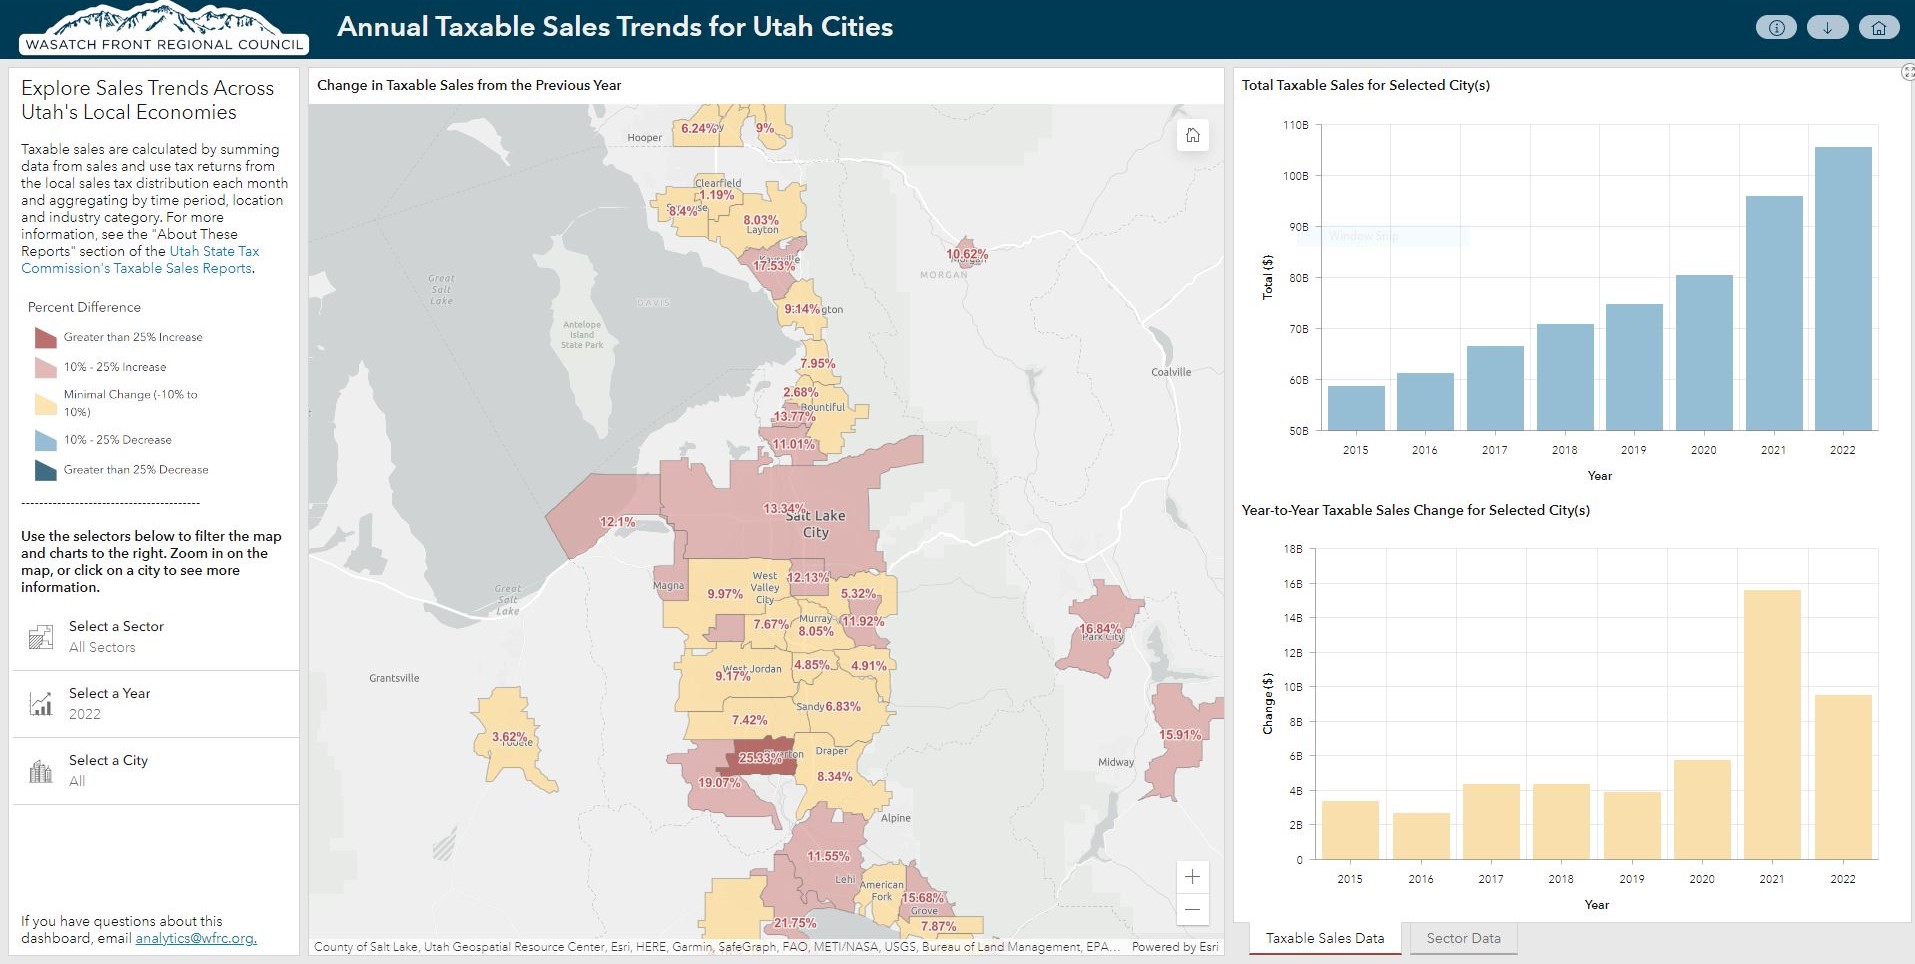
WFRC’s March Map of the Month compares year-to-year taxable sales between 2015 and 2022, using data from the Utah State Tax Commission (USTC), for mid and large-sized cities. This new dashboard is an upgrade to our previous COVID-era taxable sales map, so you can view these trends in a more interactive fashion.
There’s lots of insight to be harvested from the taxable sales data published by the Utah State Tax Commission – What sectors make up the largest share of sales for specific cities? How are online sales impacting the traditional retail and entertainment sectors? What’s the relationship between city growth and tax revenues in different parts of the region? New data-filtering capabilities and interactive charts allow you to quickly uncover answers to questions like these and more.
WFRC plans to update this map as USTC releases data for future years. An extended dataset going back to 1998 is available for download in the upper right corner of the map. Have a question about the WFRC region? Drop us a line at analytics@wfrc.org.
Related Posts