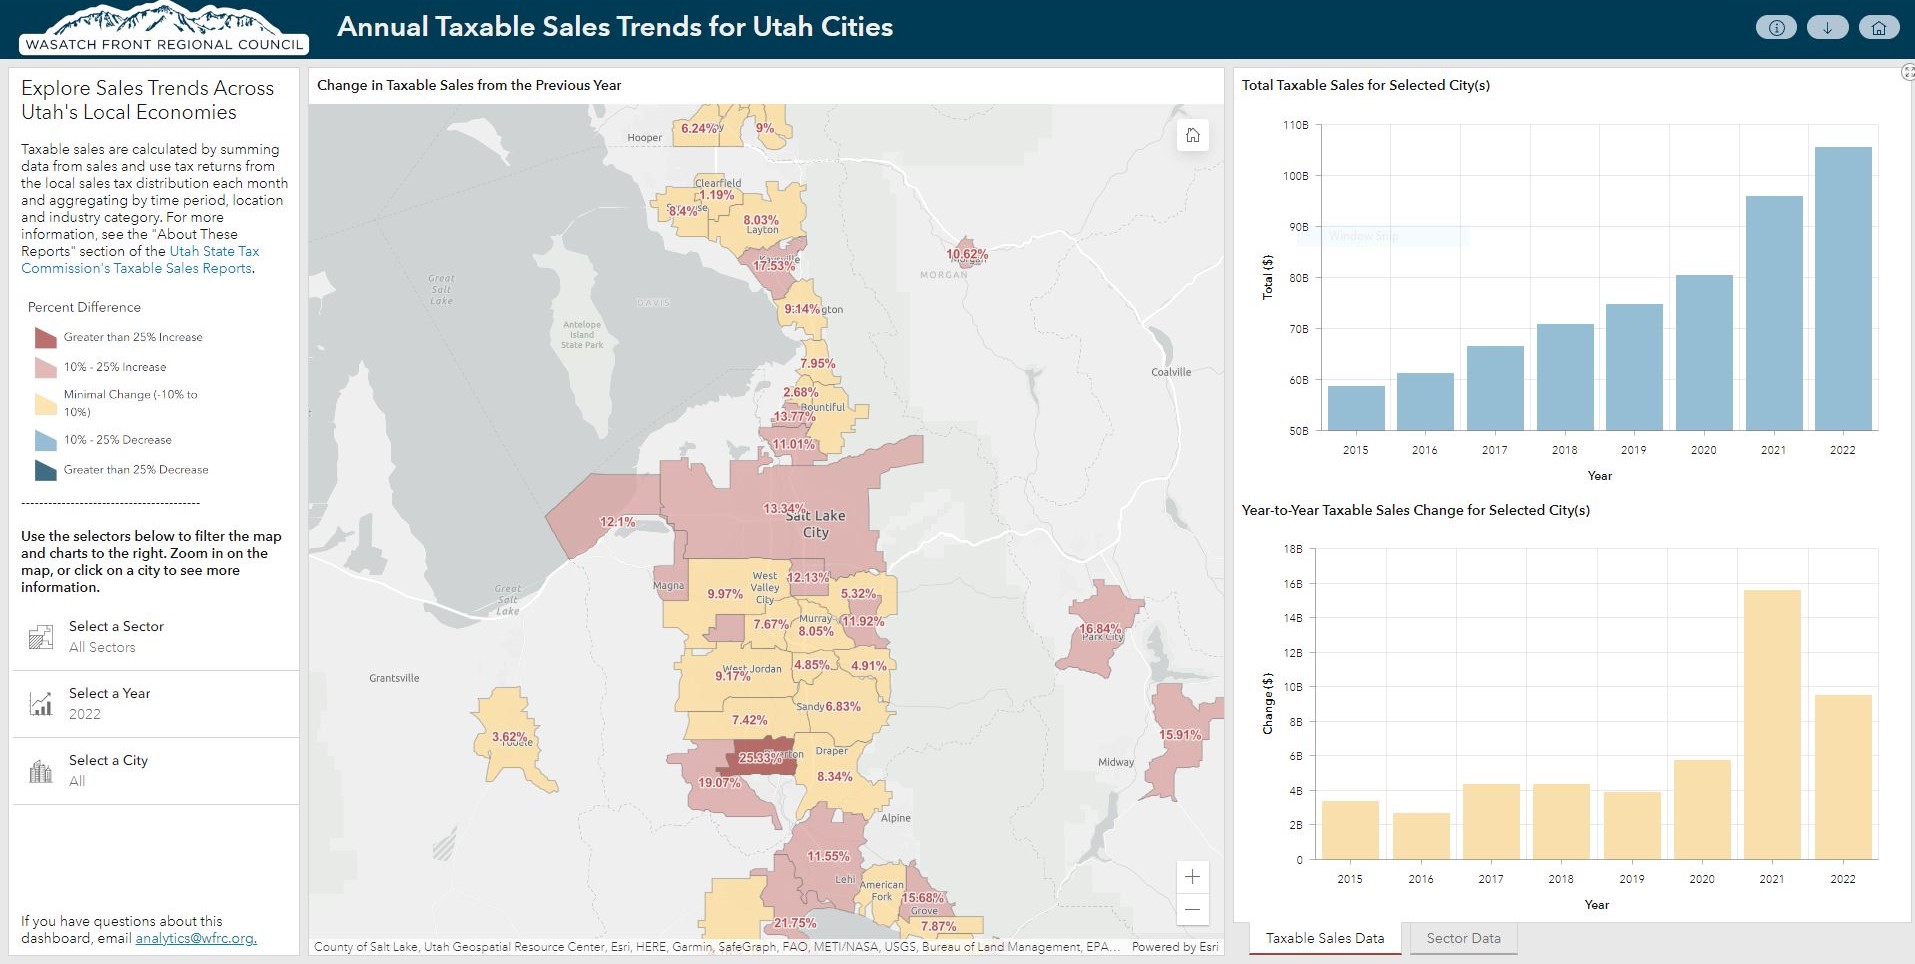
Compare year-to-year taxable sales between 2015 and 2022, using data from the Utah State Tax Commission (USTC), for mid and large-sized cities. This new dashboard is an upgrade to our previous COVID-era taxable sales map, so you can view these trends in a more interactive fashion.

Map of the Month: Expanded Housing Suitability Calculator
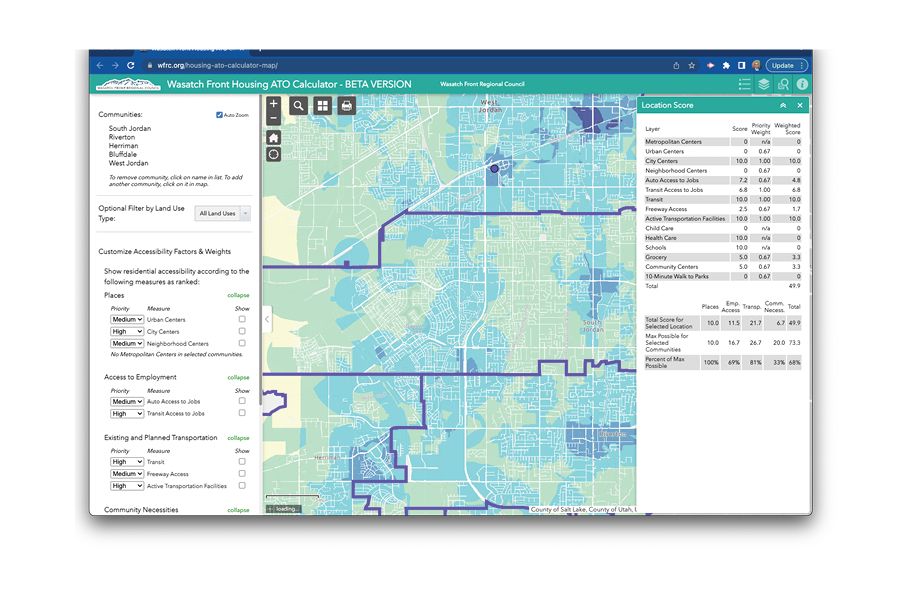
Housing continues to be a key issue along the Wasatch Front. As communities work to address housing demand challenges, it’s important to understand the differing levels of access to opportunities (ATO) that various locations provide to their residents. As promised, we’ve expanded our Housing Suitability tool, originally built this summer for Weber County, to work for cities in Weber, Davis, Salt Lake, and Utah counties.
Simply put, the Housing Suitability Calculator tool lets you decide what criteria are most important for siting new housing and then does the calculations and mapping to show you how well locations your areas of interest perform in terms of ATO.
To get started, first use the map to click on a city or group of cities to analyze. Then, adjust the Custom Accessibility Factors and Weights to create a custom housing suitability map. After the map redraws, you can click on any single location and see how well it scores across all of the accessibility factors you’ve chosen. Here’s a more detailed ‘how-to’ walk through.
Happy mapping!


