In 2020, WFRC started a Map of the Month (MotM) series for its newsletter. The MotM typically spotlights GIS-based information directly relevant to WFRC projects, programs, or other transportation, land use, and economic development issues/interests. While many of our features are interactive web maps that also contain links to download the GIS data, the only real criteria for each month’s entry is that some sort of map is involved.
For additional information regarding any of the maps of the month — or if you have an idea for a future map of the month feature — please contact the WFRC Analytics group.
Other resources: WFRC Map Gallery and data.wfrc.org.
| Map | Title and Description |
|---|---|
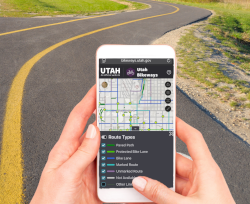 | May 2025Utah Bikeways MapMay is National Bike Month, and, accordingly, we're pleased to share a new tool for anyone interested in exploring Utah's growing network of multi-use pathways, bike lanes, and bike routes.The new bikeways.utah.gov website highlights the current bicycling network to help residents and visitors take advantage of these bike-friendly facilities for both transportation and recreation. On the map, users can view paved trails, different types of bike lanes, and other on-street bike designations, and an estimated level of comfort for different experience levels. Importantly, this tool allows users to provide feedback that will help keep the map current. Are you proud of a new or upgraded bikeway that just opened in your community? Or do you see something that is missing on the map? Just click on the map and submit your suggestions for review and inclusion. Your feedback will help provide better information to the public and to the organizations that use this GIS map data to develop plans and prioritize future additions to the bike network. And please share this resource with others! The more people who use the map, the better it will be. The bikeways map was created by developers at the Utah Geospatial Resource Center (UGRC) (the State's GIS coordination office) in partnership with WFRC and Utah's transportation planning agencies. |
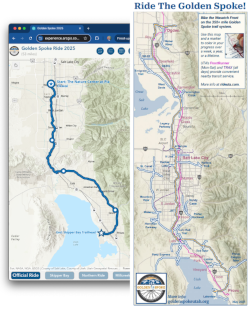 | April 2025Celebrating the Golden Spoke with Maps and a RideThe annual Golden Spoke Ride celebrates the now 370-mile system of connected multi-use trails that span the Wasatch Front, and of course, the main Golden Spoke route itself connecting a series of paved multi-use pathways from Ogden all the way to Provo.Our Map of the Month features two Golden Spoke-related maps — the 2025 Event Map for the May 10th Golden Spoke Rides and an updated overview map of the whole Golden Spoke regional system that you can print and track your progress towards riding the whole Golden Spoke trail system. For more information and free registration, please visit goldenspoke.net. Get out and enjoy our trails! |
 | April 2025 Bonus MapAnnual City-level Taxable SalesSince the height of uncertainty during the COVID-era shutdowns in 2020, WFRC has been mapping annual Taxable Sales data from the Utah State Tax Commission to make it easier to see and compare trends.Taxable Sales are a direct indicator of city and regional economies' performance and resiliency. Sales taxes support local and state transportation project funding. We've updated the map to include the latest data for the year 2024. |
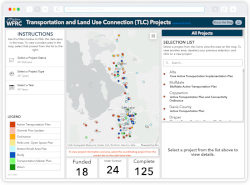 | March 20252025 TLC Awards and Interactive Project MapThe new TLC projects announced during the March Regional Growth Committee meeting, as well as all project locations funded to date, are shown on this 1-page PDF map.We've also updated our interactive TLC Projects map, which shows all of the 167 active and completed local projects that have been funded through the TLC program across the region. New features include the ability to sort projects by status, type, and year, and a display showing the number of projects funded, under contract, and completed. Users can click on and read project applications, access project websites, and access the resulting plans and reports when the project is complete. |
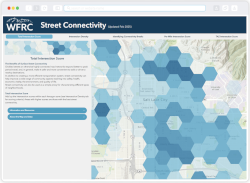 | February 2025Taking a Look at Our Street ConnectivityGridded streets and well-connected road networks reduce congestion by offering more direct routes and making it safer and easier to walk or drive to nearby destinations. Street connectivity can determine whether you're stuck in traffic or free to walk, bike, or easily drive to your destination.Our February Map of the Month highlights Street Connectivity. This map uses an updated analysis of the types and densities of intersections on our street network to show how interconnected the Wasatch Front and Back surface streets are – lighter areas have less street connectivity, and darker areas are more connected. The analysis draws on methods in the Utah Street Connectivity Guide which also contains resources for cities looking to improve connectivity. Beyond improving transportation, street connectivity enhances safety, health, economic vitality, the environment, and overall quality of life. |
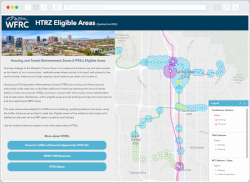 | January 2025Updated Housing and Transit Reinvestment Zones MapWFRC recently updated our Housing and Transportation Reinvestment Zone (HTRZ) Eligible Areas map.One key strategy of the Wasatch Choice Vision is to create and enhance city and town centers as the hearts of our communities — walkable areas where activity is focused, with places to live, work, and play. Areas around high-capacity transit stations are ideal centers because they can increase housing options, provide access to opportunities for jobs, education, and commerce, and enhance quality of life even as Utah continues to grow. HTRZs are a policy and financing tool, authorized under state law, to facilitate additional mixed-use development around transit stations. Cities can propose HTRZs, working with other public- and private-sector stakeholders, around existing and near-term planned rail and bus rapid transit (BRT) stations. An HTRZ enables a portion of incremental tax revenue growth, within a defined area near a transit station, to support the costs of enhanced development in that area. The HTRZ map shows areas around existing and near-term planned rail and BRT stations, within which an HTRZ can be proposed. The map also shows stations where HTRZs have already been authorized. Learn more about HTRZs and view the interactive map at wfrc.org/programs/htrz. |
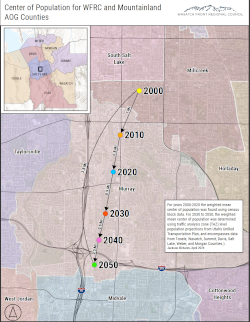 | December 2024Wasatch Urban Area Population CenterIf you're a demographics nerd, you may already be familiar with "center of population" maps. These maps are an effective way to convey how the overall population distribution is changing over time. Census data and modern GIS mapping software make these maps easy to produce.The national center of population has moved steadily west from Maryland in 1790, when the first Census was conducted, to southcentral Missouri in 2020. The University of Utah's Gardner Policy Institute has mapped the statewide population center for Utah from 1950 to 2020, which was moved north in earlier decades, and then south as Washington County and other more southern areas began to develop rapidly. Not to be left out, for our December map of the month, we thought it would be interesting to look at the population center for the eight Wasatch Front and Back counties that make up the WFRC and MAG associations of government (AOGs). With this population center map, we've included a look forward to where the center point is expected to be located in future years according to the transportation analysis zone-level population forecasts we produce through 2050. Spoiler alert, while the population is currently moving southward, that movement is expected to slow, and Murray City will continue to host the population center of this area for the next three decades. |
 | November 2024Age Groups and Household SizeThe holidays are often a time for different generations to gather together. Accordingly, our map of the month, Age Groups in Utah, is a quick look at the distribution of age cohorts along the Wasatch Front, drawing from data collected as part of the 2020 Census.Not surprisingly, different neighborhoods have different distributions of youth, seniors and everyone in between. The map allows users to view the geographic distribution of three different age cohorts: 0-17, 18-65, and 65+ — plus household size at a census tract level (sub-city) geography. Utah's age characteristics are somewhat unique as we are the youngest state in the country — 3.5 years younger on average than the next youngest state, Texas. And, our demographic differences definitely impact how and where we travel, and therefore how we provide transportation options within our region. Whether or not you're planning a multi-generational gathering this month, we hope you enjoy this look at another facet of our regional landscape, and that you'll have a great holiday season! |
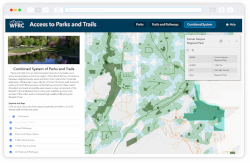 | October 2024Park and Trails Accessibilty (updated)WFRC’s Analytics Team has just completed a full refresh to our region’s Access to Parks and Trails web map. This map shows how many residents in each area can easily access nearby parks and trails, and enjoy the benefits of being active and connecting with our surroundings.The map spotlights park space, family-friendly multi-use pathways, and trailheads, and neighborhoods where these critical assets are within either a 5- or 10-minute walk. The analysis represented in this map helps us all understand our current strengths and where additional resources may be needed as demand for outdoor recreation continues to grow in our region. Look up where you live, work, or like to play today, and for more information, contact analytics@wfrc.org. |
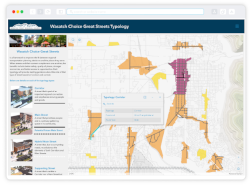 | September 2024Wasatch Choice Great StreetsWasatch Choice Great Streets is a framework for making regional transportation decisions that complement the places that serve as the heart of each community.The Great Streets toolkit is for stakeholders across the Wasatch Front Region — small and larger communities, transportation agencies, and private sector partners — to collaborate on the planning and delivery of changes to major streets in ways that balance mobility and place-making. Included in the toolkit is an overview of the Great Streets framework (pdf) and the Great Streets typology interactive map for the WFRC area. This map characterizes the role that streets within metropolitan, urban, and city-level Wasatch Choice Vision Centers might best play in their communities. When streets and their context complement one another, the benefits accrue in safety, quality of place, stronger economies, and access to opportunities. The Great Streets typology is designed to be a living map. Please pass along any feedback to Ted Knowlton or Julie Bjornstad. |
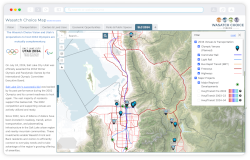 | August 20242034 Winter Olympics - Planned Venues & Transportation SystemThe official award was made by the International Olympic Committee during its July 24th, 2024 meeting in Paris, much to the delight of the watch party crowd that gathered at 3 a.m. in Salt Lake City's Washington Square.As Utah's preparations to host the 2034 Olympics are mutually complementary with the Regional Vision, we've added a 'SLC 2034' map to the Wasatch Choice interactive map. The Games will inspire us all to stretch our aspirations for the future we are creating for our Region. This new map displays the planned venues for the Games, together with the major road and transit transportation system that will serve spectators, workers, volunteers, officials and athletes in 2034 – all of which already exists or was already planned for completion to meet Utahn's transportation daily needs prior to the Olympics award. The map also allows you to see the groundbreaking set of transportation improvements built for the 2002 games, the impressive additions that have opened since the last Olympics, and new transit and road projects expected to be finished in time for 2034. |
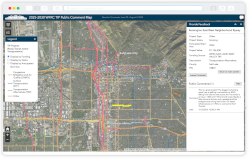 | July 2024Public Comment Map: Draft 2025-2030 TIPWorking closely with UDOT, UTA, and local government partners, WFRC has prioritized hundreds of near-term transportation projects that aim to enhance mobility, strengthen the economy, connect communities, increase access to opportunities, and improve quality of life along the Wasatch Front.These projects, totaling more than $9 billion in federal, state, and local funding, are listed in the current draft of the 2025-2030 Transportation Improvement Program (TIP), open for public comment through August 3, 2024. You are invited to explore project locations and details in the Draft 2025-2030 TIP Public Comment Map and review the corresponding air quality conformity determination (Memorandum 42a). The map displays projects based on funding source, project status, and anticipated start year. It also allows project-specific comments to be submitted, as well as general comments not linked to a specific project. |
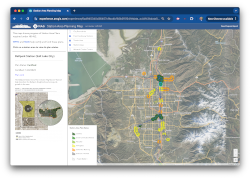 | June 2024Station Area Planning Progress MapHB 462 (bill, summary) took effect in 2022, tasking cities with the development and adoption of Station Area Plans (SAPs) for areas within ½ mile of rail transit stations and ¼ mile of bus rapid transit (BRT) stations.Cities are working hard to meet the goals of this legislation, and MAG and WFRC have partnered to create the Station Area Plan interactive map to track the progress of this effort across the Wasatch Front. This new map shows the planning status for applicable stations, from beginning-to-plan to the final step, certification of each plan by the WFRC and MAG regional councils, respectively. The SAP process aligns with the Wasatch Choice goals of advancing transportation choices, housing options, parks and public spaces, and city and town centers. Click here for more information about WFRC's technical support resources and certification process for SAPs. |
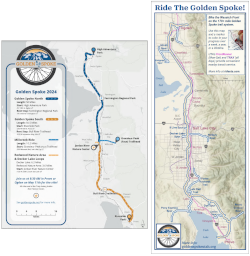 | May 2024Golden Spoke Trail MapsEach year, hundreds of riders participate in the free Golden Spoke Ride, which celebrates the 170+ mile system of connected multi-use trails that span the Wasatch Front. The 2024 event (May 11th) highlights not only the direct trail connections between Ogden and Provo but also the newly completed Parley’s Trail bridge connecting to the Jordan River Parkway and the Crosstown Trail in West Valley City leading to Decker Lake.Our May Map of the Month features two Golden Spoke-related maps – an interactive map of the routes for the May 11th Golden Spoke Ride event, and a printable coloring map of the Golden Spoke and spurs that form the backbone of the regional multiuse pathway system so you can keep track of your progress towards riding the whole Golden Spoke trail system! We wish everyone a happy and safe bike month! |
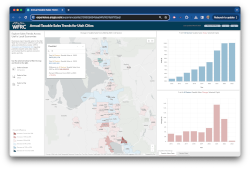 | March 2024Taxable Sales Map (Updated March 2024)Our Map of the Month post for March 2024 features the Taxable Sales Trends Map for medium and large Utah cities – now with the latest summary data reported to the State Tax Commission for the year 2023.Taxable sales are a critical measure of consumer and business activity in Utah communities. And accompanying sales tax revenues help fund everything from public services to road projects and transit operations. The interactive map format allows viewers to explore taxable sales totals in their communities and neighboring jurisdictions. It also displays sales by business sector and graphs trends dating back to 2015. Have fun exploring this important and interesting economic indicator! |
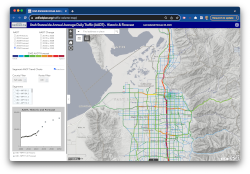 | February 2024Updated Traffic Volume History & ForecastUsed by transportation professionals, city planners, commercial interests, and the general public, our Traffic Volume History and Forecast is one of our most popular web maps. And – big news – it just got two key updates.First, the forecasted annual average daily volumes (AADT), reviewed and refined from the Wasatch Front Travel Demand Model, have been updated to incorporate recent trends and the impacts of the road and transit projects in WFRC's 2023 - 2050 Regional Transportation Plan. Historic traffic estimates have also been updated through 2022. Second, we've moved this web map to a new URL address. The updated data and map are now found at: https://unifiedplan.org/traffic-volume-map/ which reflects the Utah transportation agencies' plan to again integrate the traffic forecasts for all of Utah's planning regions into one resource. We'll be adding data from Cache MPO, Dixie MPO, MAG & UDOT (for the rural areas of Utah) in the coming months. |
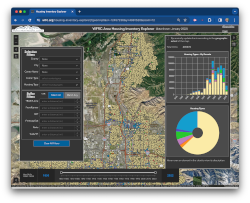 | January 2024Updated Housing Inventory Explorer (v2.0)Imagine a time machine that lets you view, from way up high, when and where housing of all types has been added to the Wasatch Front. That's what the newly updated WFRC Housing Unit Inventory web map -- our featured map of the month for January -- lets you do. We've expanded the map's display and filtering capabilities and have updated the housing data to reflect conditions as of January 2022.The list of key features in our updated map includes the ability to filter the housing data by city, Wasatch Choice Vision centers, housing types, year built, and proximate freeway exits, transit stations, parks and trailheads. In addition to coloring the map and charts by housing type, you can switch to color schemes for built decade, land use intensity, and valuation. Enjoy your exploration of Wasatch Front's housing trends, choices, successes, and opportunities. We're partnering with MAG to add data for Utah County in the near future. Drop us a line at analytics@wfrc.org if you have any questions. |
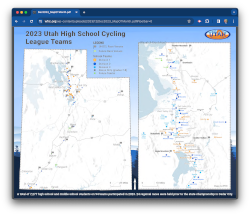 | December 2023Utah's Next Generation of Cycling and Trail EnthusiastsTaking a quick look at our December map of the month featuring the 'Utah High School Cycling League (UHSCL) – the largest high school mountain bike league in the nation – it's clear that riding a bike isn't going out of style in Utah anytime soon.Upgrades to the active transportation system (new paved pathways, dirt trails, urban bike lanes, and trailheads) seek to meet Utah's continued demand for a high level of outdoor access, mobility, and safety. Planning and project funding opportunities at the local and state level include the new UDOT-led Utah Trails Network program for paved pathways, DNR's Utah Outdoor Recreation Grant program, and WFRC's Transportation Land Use Connection (technical planning assistance that includes parks, trails, and public spaces). In just its 12th year of existence, the wildly successful 2023 UHSCL season had 7,277 Utah students participate in its 25 week, team-based mountain biking program this year. Two thirds of the 94 teams' riders were high schoolers, and one third were 'devos' (grade 7 and 8). The UHSCL season begins with 15 weeks of bike skills development, coaching, and training and concludes with 4 regional race weekends for each team. With 2,500+ qualifying racers, this year's state championship weekend, held Oct 20-21 just outside of Cedar City, is thought to be one of the largest youth bike events in the US, if not the world. The 43 teams in WFRC's area (Davis, Morgan, Salt Lake, Tooele, Weber, and Southern Box Elder counties) accounted for just over half of UHSCL's youth participants this season. The Corner Canyon (Draper) team had the state's largest high school participation (214 riders), while Farmington, which included both high school and middle school riders together under one team, had the most total riders (256) in the state. |
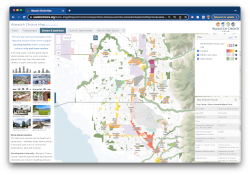 | November 2023City and Town Centers & Regionally Important Land UsesOur map of the month highlights the 'Centers and Land Uses' tab in the Wasatch Choice Vision interactive map. One of the four key strategies of the Wasatch Choice Vision is to create and enhance city and town centers as the hearts of our communities – walkable areas where activity is focused, with places to live, work and play.City and Town Centers are areas that communities have identified as their desired locations for walkable, more intensive mixes of housing, employment, and amenities. Centers offer valued resources to their residents, workers, visitors, and neighbors including places to gather, shop, and otherwise replenish. The four different levels of Wasatch Choice centers – Metropolitan, Urban, City, and Neighborhood – reflect local communities choosing the size of development that best suits current and planned land use objectives for their centers. Creating more opportunities for growth to occur in Centers will also help to preserve the character of existing suburban and rural neighborhoods. Our region continues to grow and City and Town Centers are one of the four key strategies of our plan for future growth – the Wasatch Choice Vision. And, Centers provide great venues to advance the other three strategies: Transportation Choices, a variety of Housing Options, and Parks and Public Spaces. Accordingly, the Wasatch Choice Centers are featured across many of the Vision Map's 'map tabs'. But, perhaps the best place to view them is from the Centers and Land Uses tab which features additional information about centers and map labels for each center's name. |
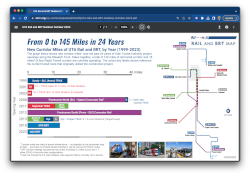 | October 2023New Corridor Miles of UTA Rail and BRT, From 0 to 145 Miles in 24 Years!The August 2023 opening of the OGX bus rapid transit (BRT) line connecting downtown Ogden with Weber State University and McKay Dee Hospital, meant that an update was needed to the UTA system map.This month, we're featuring a customized look at the updated UTA Rail and BRT map that highlights the Wasatch Front's high-capacity transit network. In just 24 years, over 145 corridor miles of rail and BRT transit corridor have been added to the UTA system, which additionally, includes extensive local bus and on-demand transit services. The first TRAX line opened in 1999, and with the U of U Stadium spur added just before the Winter Olympics, 17 miles of TRAX light rail corridor were operational for the 2002 Games. Now we're at 145 miles of transit corridor, which enables transit access to millions of Utahns, now and in the future. Wow! These important transit investments also illustrate the importance of planning for future projects to include in the regional transportation plans (RTP) and Utah’s Unified Transportation Plan, where ideas like TRAX, FrontRunner, and BRTs – together with roadway and active transportation projects – first get their start. The right mix of planning, funding, and operational expertise is providing an impressive and expanded transit backbone that will help meet the Wasatch Front's transportation needs for generations to come. |
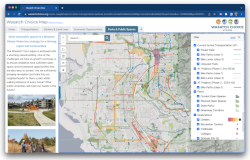 | September 2023Wasatch Choice Vision Parks & Public Spaces MapParks and Public Spaces is a key strategy of the Wasatch Choice Vision for a thriving region and communities.This month, we are featuring the Parks & Public Spaces map 'tab' within the Wasatch Choice Vision interactive map which features parks and other public open spaces, trailheads, and potential greenway corridors. It also includes existing and planned paved multiuse pathways and other protected bikeways and bike lanes. Additionally, the map shows the locations of Wasatch Choice Centers, schools, and local recreation centers. Use the information in the Parks & Public Spaces map to explore the availability of open space across the region and, also, how well the current and future ‘active transportation’ system connects users in your community to basic needs and amenities. See something missing that needs additional consideration? We're happy to collect feedback and get it to where it needs to go. |
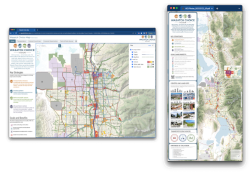 | August 2023Updated Wasatch Choice Web Map & PosterThe Wasatch Choice Vision map shows how our region's transportation systems, centers, land uses, and natural amenities are envisioned to work together in the year 2050. The Wasatch Choice Vision map is available as an interactive web map, as well as large and medium-format posters available from the map gallery at maps.wfrc.org.We've featured the Wasatch Choice Vision maps in past newsletters, but with this just-completed, major update to the web map and poster versions we invite you to explore them again for the first time. The refreshed maps and supporting content harmonize the map with the latest elements of the Vision, including the roadway, transit, and active transportation projects planned and expected in WFRC’s and MAG’s recently adopted regional transportation plans (RTPs). |
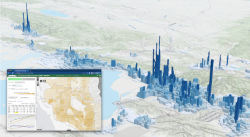 | July 2023Updated Household and Job Forecast MapOn occasion, we take over this Map of the Month section to briefly present an important GIS map data topic. This is one of those occasions, so get ready!In a nutshell, with each four-year adoption cycle of the Regional Transportation Plan (RTP) – which happened for the WFRC area this past May – a new updated Household and Jobs Forecast GIS dataset becomes official. Accordingly, if you or your colleagues are users of the regional forecast data, we encourage you to consider updating to the latest version (links below). The regional forecast is the default starting point for analysis using the Wasatch Front Travel Demand Model and for other general planning work. It projects population (pictured above), household, and employment counts and their densities across the Wasatch Front's 3,500 traffic analysis zones for each year from 2023 to 2050. The forecast is also available at a 'city area' level. You can view the latest forecast in the Wasatch Front Household and Job Forecast web map. If you want to work with the information in your own software, you can download the latest statewide forecast datasets here. Note that the forecast data is official for the WFRC (Brigham City to Draper) and Mountainland Association of Governments (Lehi to Santaquin) areas, and in final--but not yet official--draft for other areas of the state. Our projections work greatly benefits from the county-level forecasting performed by the University of Utah Gardner Policy Institute, in addition to valuable feedback received from cities and other regional stakeholders. Thank you very much to all who partnered to support this forecasting effort and, of course, please let us know if you have any questions ( |
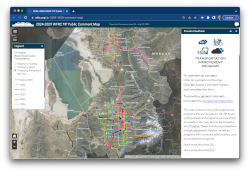 | June 2023Draft 2024-2029 TIP Public Comment MapWFRC, along with our partners, UDOT and UTA, have prioritized hundreds of near-term transportation projects that aim to enhance mobility, strengthen the economy, connect communities, increase access to opportunities, and improve health along the Wasatch Front.These projects, totaling more than $10 billion in federal, state, and local funding, are listed in the current draft of the 2024-2029 Transportation Improvement Program (TIP), open for public comment through July 29, 2023 You are invited to explore project location and details in the Draft 2023-2028 TIP Public Comment Map. The map can display projects based on funding source, project status, and the anticipated start year. And, as its title implies, the map allows anyone to submit project-specific comments as well as general comments not linked to a specific project. Submitted comments will help inform the final approval process for the TIP later this summer. Take a look and pass along any feedback you would like to share! |
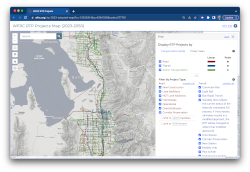 | May 20232023-2050 RTP Projects Map (Adopted)The Council's adoption of the 2023-2050 Regional Transportation Plan (RTP) on May 25th was a once-every-four-years event. So it should be no surprise that May's Map of the Month is the Adopted 2023-2050 RTP Projects Map.The new RTP Projects map uses a similar user interface – with basic and advanced project filtering controls – to earlier versions of the draft RTP map. You can explore the RTP projects by mode or by phase, or use the advanced filtering capabilities to look at specific project types, cost ranges, ownership, and right-of-way needs. Don't forget to update your bookmarks and other links to the current RTP map. |
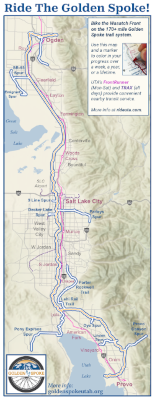 | April 2023Track Your Progress on the Golden Spoke Trail SystemNational Bike Month (May) is soon upon us. What better time to take on the challenge of traversing the Wasatch Front's amazing Golden Spoke paved, multi-use trail system in its entirety.While it is possible for the fit and ambitious to ride the main Golden Spoke trail in one long day, it's likely a more practical and a more enjoyable experience, if you break it up into smaller sections to ride over several weekends or even a year. (May 13th ride event and other Golden Spoke resources below) And that's where our April Map of the Month comes in handy. Start the challenge in Ogden or Provo or anywhere in between. Print the map and use a marker to track your progress along the way. The map includes the main trail, named spurs, and the UTA FrontRunner (Mon-Sat service) and Trax (all day service) train system. Both allow bicycles onboard and have stations along trail routes, making for a convenient way to travel to and from your adventures on the Golden Spoke. Happy pedaling! |
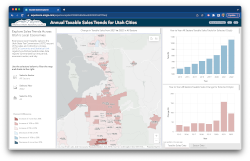 | March 2023Annual Taxable Sales Trends for Utah CitiesTaxable sales and accompanying sales tax revenues help fund everything from public services to road projects and transit operations. With the worst of the COVID-19 pandemic behind us, local economies and regional taxable sales patterns are moving toward 'new normal' levels.WFRC's March Map of the Month compares year-to-year taxable sales between 2015 and 2022, using data from the Utah State Tax Commission (USTC), for mid and large-sized cities. This new dashboard is an upgrade to our previous COVID-era taxable sales map, so you can view these trends in a more interactive fashion. There's lots of insight to be harvested from the taxable sales data published by the Utah State Tax Commission – What sectors make up the largest share of sales for specific cities? How are online sales impacting the traditional retail and entertainment sectors? What's the relationship between city growth and tax revenues in different parts of the region? New data-filtering capabilities and interactive charts allow you to quickly uncover answers to questions like these and more. WFRC plans to update this map as USTC releases data for future years. An extended dataset going back to 1998 is available for download in the upper right corner of the map. |
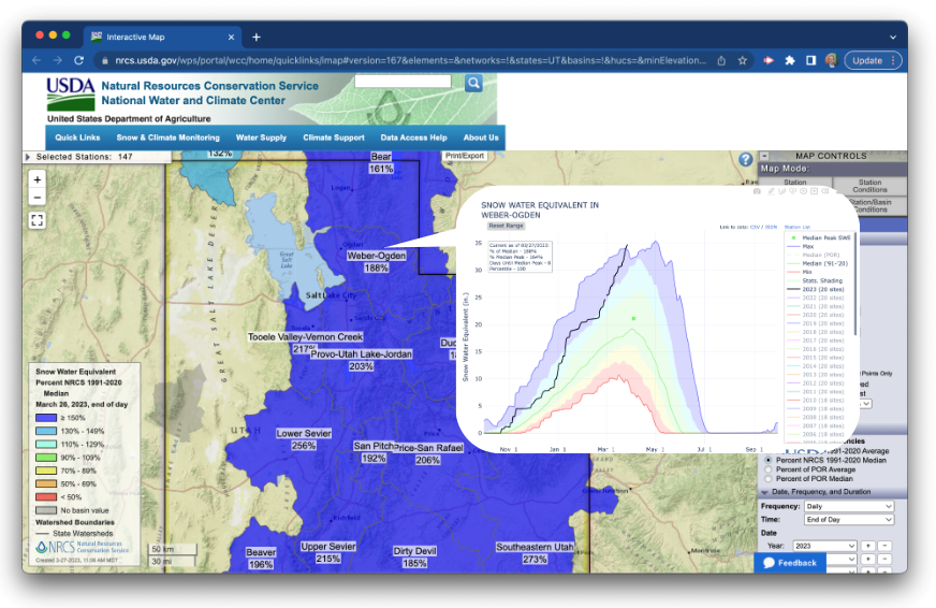 | March 2023 Bonus MapUSDA NRCS Watershed Monitoring Map"We are living in a snow globe."That's how Utah Avalanche Center forecaster Drew Hardesty began his daily mountain weather briefing over a month ago on February 23rd. He jokingly concluded his summary with "The longer range [weather] models have storms until the end of time" A month later, the 2022-2023 winter continues to deliver truly exceptional winter precipitation all across Utah. Many areas are breaking all time records for snowpack water measurements. That's great news, considering our recent drought years, and hopefully, the Spring runoff season will be gentle in its impacts to our communities and infrastructure. Check out this USDA NRCS Watershed Monitoring Map using a large network of monitoring stations to summarize the snowpack for Utah's major watershed basins, complete with ample graphing of water-content trends across the seasons. |
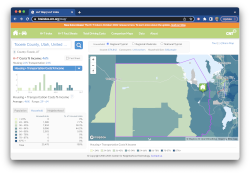 | February 2023Housing + Transportation Index from CNT (February 2023)Where to call home?. In choosing a location to live, cost factors into almost every household's decision. There's the cost of owning or renting your home, and the cost – in time and money – of the trips you'll need to make, some of them nearly everyday. Housing and transportation are the two biggest household expense burdens and have a significant impact on a family's financial outlook. The Wasatch Choice goal “Housing Choices and Affordable Living Expenses” purposely acknowledges that much more goes into determining affordable locations than just housing expenses.The Center for Neighborhood Technology (CNT) maps the average housing plus transportation cost (a.k.a. H + T, for short) at county, city, and neighborhood (census block group) levels. To create the metric displayed in their H + T Index interactive map, CNT leverages census, transportation, employment, and other economic data across each region of the nation. You can explore the landscape of H + T cost across the Wasatch Front by typing any place name into the search box to quickly get started. But to pique your interest, CNT estimates that H + T is greater than 45% of a family's budget, for 46.3% of WFRC-area households. And, good news, if you want to work with the new 2020 H + T dataset in your own affordability and other analyses, CNT has made their new updated 2020 H + T dataset downloadable at no cost, under a simple data license agreement. |
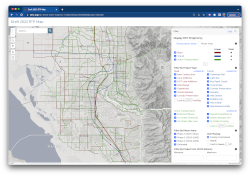 | January 2023Draft 2023 Regional Transportation Plan (RTP) Project ViewerWFRC works with partners and stakeholders to develop an update to the Regional Transportation Plan (RTP) for the Wasatch Front every 4 years. The RTP process looks out 20-30 years to prioritize the list and timing of regionally significant roadway, transit, and active transportation projects, all while considering estimated project costs and overall expected future revenue available for future transportation projects.The RTP project list is a complex dataset as it is map-based, presents a variety of transportation modes and project types, and does so over the 3 time periods (phases) of the RTP. During the development of the draft RTP, WFRC gathers ideas – from key agencies, local government, and other stakeholders – for new projects and modifications to projects already planned. Our new RTP Project Viewer has been designed to allow a diverse set of stakeholders to explore the transportation projects in the current Draft 2023 RTP and to easily provide project-specific feedback, by clicking on any project in the map and entered their comment. Public feedback will be gathered using this map from January 27 to February 26, 2023, pending a decision by the Council (WFRC’s Board) to open the Draft RTP for public comment. During the public comment period, general and other feedback may also be submitted in writing [more info]. The RTP Project Viewer opens, by default, with a view of all projects, colored by the three project mode groups (roadway, transit, and active transportation). Users can toggle the map between a project mode coloring and a phasing period coloring and can expand the advanced filter to select specific project types, phasing, and cost ranges of their choosing. This new map was built through a collaboration between WFRC’s Long Range Planning and Analytics groups, and the web map developers at the Utah Geospatial Resource Center. The code repository can be found here. |
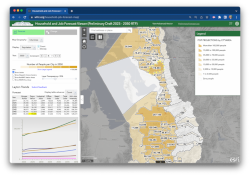 | December 2022Household and Jobs Forecast Web MapWhat will the Wasatch Front look like in ten years? How about in 2050?In support of WFRC’s long-range planning work, our Analytics Group is responsible for projecting where people will live and work in our region in the future. Our forecasting is done for traffic analysis zones (TAZs), which average about one square mile in size, and relies on real estate development modeling software, a diverse collection of input datasets, and input/feedback from local government and other stakeholders. Important inputs to the forecasting process include parcel-level data from county assessors, current job counts and locations, local government general plans, the Wasatch Choice Vision for transportation and land use, and county-level projections compiled by the Gardner Policy Institute. WFRC’s current household and jobs forecast update is expected to be finalized in May of 2023 and will be used in conjunction with transportation investment decisions and other local and regional planning work. But you don’t have to wait until then to start exploring this current update at the TAZ and ‘city area’ levels in our Household and Jobs Forecast web map. The web map lets you view projections for specific years, display and graph changes, intensities, and select from several geographic summary levels. Have fun touring our future projections, but don’t forget to come back to the present and do your part to keep us on the best path forward |
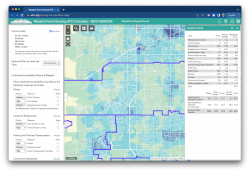 | November2022Expanded Housing Suitability CalculatorHousing continues to be a key issue along the Wasatch Front. As communities work to address housing demand challenges, it’s important to understand the differing levels of access to opportunities (ATO) that various locations provide to their residents. As promised, we’ve expanded our Housing Suitability tool, originally built this summer for Weber County, to work for cities in Weber, Davis, Salt Lake, and Utah counties.Simply put, the Housing Suitability Calculator tool lets you decide what criteria are most important for siting new housing and then does the calculations and mapping to show you how well locations your areas of interest perform in terms of ATO. To get started, first use the map to click on a city or group of cities to analyze. Then, adjust the Custom Accessibility Factors and Weights to create a custom housing suitability map. After the map redraws, you can click on any single location and see how well it scores across all of the accessibility factors you’ve chosen. Here’s a more detailed ‘how-to’ walk through. |
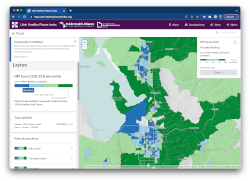 | October 2022Utah Healthy Places IndexOn October 20th, Utah Department of Health and Human Services released its new and innovative mapping tool, the Utah Healthy Places Index (HPI).The Utah HPI provides community leaders, policymakers, planners, transportation agencies, and other stakeholders to understand -- through sound and validated, neighborhood-level data -- the community conditions known to impact health, such as job opportunities, education, and transportation. State and local stakeholders can use the Utah HPI alongside input from community residents to prioritize investments, resources, and programming in neighborhoods where health needs are greatest, ensuring that all residents have what they need to be healthy. Planners and transportation agencies can use the tool to analyze data and prioritize resources as they update their regional or local area plans, including future investments in health-promoting infrastructure such as transit service, parks, multiuse pathways, and bike lanes. Regional organizations that span multiple communities or regions of Utah can use the tool to study the different areas they serve and advocate for increased resources and greater investments in these locations. The Utah HPI allows users to:
|
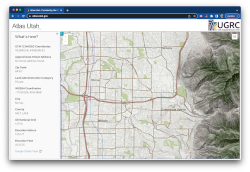 | September 2022UGRC's atlas.utah.govDigital mapping - a.k.a. geographic information systems or GIS – greatly informs and supports the transportation-related planning work done by WFRC and its partners.Success with digital mapping is completely dependent on the availability of quality, up-to-date map data. It would be nearly impossible to work alone in this space. Luckily, Utah’s cities, counties, and state agencies are recognized for their leadership, skill, and collaboration to bring map data together for many important uses including emergency response, stewardship of our natural areas, and infrastructure planning and management. Whether you want to explore your neighborhood or a spot for your next Utah outdoor adventure, our September map of the month, atlas.utah.gov, is a great general purpose map viewer. And, what’s cool about this map and placefinder is that it is built entirely from Utah’s own, vast set of GIS data resources that are compiled and distributed by the Utah Geospatial Resource Center (UGRC). These home-grown public data assets are periodically harvested by the world's big commercial mapping apps and have also been a key inputs over the years to improving Census and other national map layers. A sampling of the many map layers depicted in the atlas site include: roads, address points, city boundaries, elevation/topos, transit and cargo rail, public lands, and Fall 2021 high resolution aerial photography. But, this is just scratching the surface of the mapping data that can be found and downloaded from Utah’s State Geographic Information Database – one of the most visited utah.gov websites. Count WFRC as a benefactor, contributor, and strong supporter of everyone’s work to keep Utah among the best mapped states in our nation. |
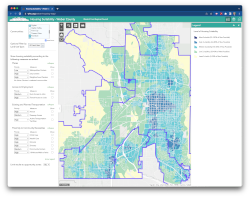 | August 2022Weber County Housing SuitabilityLocation, Location, Location. This age-old maxim still rings true.As the Wasatch Front grows, the residential development market will continue to provide new housing options. If you’re thinking about where new housing might best fit within your community, there are a lot of factors to consider, including the level of access to basic needs at potential locations. Our August Map of the Month is the new Weber County Housing Suitability interactive map that allows users to set their own criteria to create a custom housing suitability map for any single city or combination of cities in Weber County. In the map a number of location-based factors are easily selected, prioritized, and displayed including urban form, access to jobs, major roads, transit, bike lanes/paths, and other community amenities. After selections are made, the map recalculates the suitability scores in real time to reflect priorities supplied by the user. This map was created as part of the Weber County Housing Affordability and Access Study, a project funded through the WFRC administered Transportation and Land Use Connection (TLC) program. We’ll be working to provide similar information in a region-wide map expected later this year. |
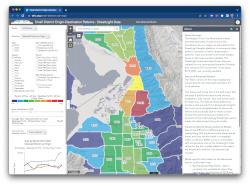 | July 2022StreetLight Index Trip Movement Estimates“Where is everybody going?” – this is perhaps the key question for understanding how well our transportation system serves the region today, and for planning for our future.UDOT, UTA, WFRC and the 3 other Utah MPO’s recently purchased access to a statewide trip movement data product -- licensed from a company called StreetLight -- that estimates travel between traffic analysis zones from an anonymized sample of mobile and onboard GPS devices. Our July Map of the Month features “StreetLight Index” trip movements (a.k.a. origin - destination flows) summarized across 123 small areas of the Wasatch Front. By default, the map provides trip information for your choice of StreetLight’s two mainstay travel modes – All Motorized Vehicles or Truck Freight. With the map, you can get a good feel for the relative amount of travel being made to or from any area of the Wasatch Front, by month and time of day. Where are trips from the University of Utah coming from during the morning commute? Midday? Or the afternoon peak? And, you can graph how the travel volume changes across the past three (interesting) years, or even by weekday or weekend. Click the link to toggle to the map’s advanced mode, which displays emerging StreetLight trip movement data for bike, pedestrian, bus transit, and rail transit modes. But, as the data for these modes is still maturing, there are a few key caveats that are explained as you make the switch to the advanced mode. The StreetLight datasets are another great information resource to add to our growing collection of regional travel information. Other tools include: the regional travel model and forecast, UDOT and UTA vehicle and ridership counting systems, commuting patterns gathered by the Census Bureau, and the statewide household travel survey just to name a few. |
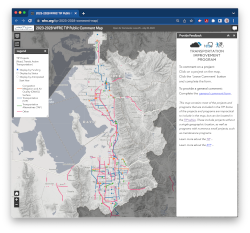 | June 2022Draft 2023-2028 TIP Public Comment MapWasatch Front Regional Council, along with our partners, Utah Department of Transportation (UDOT) and Utah Transit Authority (UTA), has identified hundreds of priority transportation projects that aim to enhance mobility, strengthen the economy, connect communities, increase access to opportunities, and improve health along the Wasatch Front.These projects, totaling more than $7 billion in federal, state, and local funding, are listed in the current draft of the 2023-2028 Transportation Improvement Program (TIP), open for public comment through July 30, 2022. You are invited to explore project location and details in the Draft 2023-2028 TIP Public Comment Map. As its title implies, the map allows users to submit project-specific comments as well as general comments not linked to a project. Submitted comments will help inform the final approval process for the TIP later this year. With the TIP interactive map, users can filter projects based on funding source, project status, and the anticipated start year of the project. New for this year’s map, when a project is selected, in addition to project details and the ability to comment, Google Street View has been integrated into the map, allowing the viewer to further explore the project site. The Transportation Improvement Program includes roadway, transit, bicycle and pedestrian projects identified for funding over the next six years in Salt Lake, Davis, Weber, Tooele, and Morgan counties, and the urbanized portion of Box Elder County. The projects vary greatly in scope, amount of investment, and stage of development. This year’s TIP includes hundreds of priority transportation projects, large and small. Here are a few project examples from the proposed 2023-2028 TIP:
|
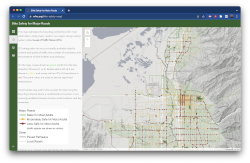 | May 2022How Safe Do We Feel While Cycling?As the days get longer and warmer, now is a great time of year to think about biking more or giving it a try if it’s been awhile.Our map of the month on bike safety provides a resource communities can explore to develop goals for improving bike (and pedestrian) access and safety, especially around city and neighborhood centers that contain key destinations, like groceries, entertainment, and other services. Research has shown that there is a large group of potential cyclists that are “interested in biking more, but concerned about safety.” A study in Portland, Oregon (Dill and McNeil 2012) found that this group represented 50-60% of the adult population – much larger than those who already bike a lot or those who had no interest. The bike safety map is presented from the perspective of an interested, but concerned cyclist, estimating the level of traffic stress (LTS) perceived by most adult, non-enthusiasts riders. LTS is calculated using an established method that looks at speeds, number of lanes, the amount of vehicle traffic, and existing bicycle facilities. On the map, major roads with an LTS score of 2 – comfortable for all adult cyclists – or better, together with separated pathways are shown as green lines. Roads and signalized intersections with a higher LTS score are shown on the map in yellow (less comfortable) and red (not comfortable). Take a look at your community, focusing on the routes that access areas that have the highest concentration of destinations that residents want or need to access. What does the comfort level look like as cyclists approach these areas from their homes? Are there comfortable and safe routes to connect with these activity centers, or does more work need to be done to improve the comfort for people on bikes and/or walking? Are there safe routes that you use in your community that you want to share with us? We’d love to hear about them. Feel free to contact WFRC's Active Transportation Coordinator, Hugh Van Wagenen (hugh@wfrc.org) to let us know how you bike around town. More resources about Level of Traffic Stress for bicyclists can be found here. |
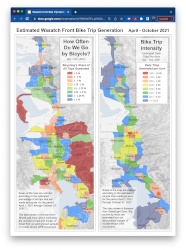 | April 2022Wasatch Front Bike Trip GenerationIn thinking ahead to May – National Bike Month – our map of the month features a new look at bicycle-based travel along the Wasatch Front.It has been said that everyone is just one bike ride away from a good mood. But, how much do people in our region travel by bicycle? The answer has, until recently, been hard to get a handle on as our region doesn’t yet have a system of bike counters to collect data similar to how we monitor road usage. But, new ‘big data’ sources can now provide some insight into how people travel and the modes that they use. WFRC and partners have been exploring trip information licensed from StreetLight, one of several commercial ‘big data’ providers, that estimates how we travel from a sample of anonymous mobile device GPS movements. This month's Bike Trip Generation Maps use the StreetLight data to estimate bicycle trips generated in the warm months of 2021, for over 120 small areas of our region. The first map looks at bicycling’s share of all trips made, and the second map shows the bike trip intensity, in daily trips per square mile of development. Why the big differences in bike trips generated across the region? It’s likely a combination of related factors including urban density, the distance to nearby attractions, the amount of bike-specific infrastructure in each city, perceived safety and comfort, and individual habits and preferences, just to name a few. These are all factors that communities can influence through transportation, land use and other projects and programs. National Bike Month is a great time to pick up the pace with a little added focus. Interested in exploring existing and planned bicycle routes and pathways near you? The Wasatch Choice Active Transportation map or our Active Transportation Data Resources maps are great places to start. In the future we’ll be doing more ‘big data’ analyses to look at travel patterns for other modes like personal vehicles, transit, and freight. If you have ideas you’d like us to research, let us know at analytics@wfrc.org. |
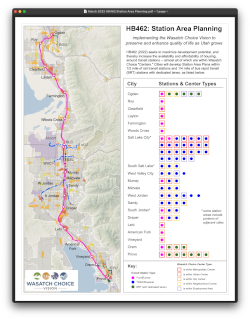 | March 2022HB462 Station Area PlanningThe Wasatch Choice Vision is foundational for our region's plan for sustaining our superior quality of life amidst continued growth. Local, regional, and state partners are working toward implementing Wasatch Choice through 4 key strategies: providing transportation choices, preserving open space, supporting housing options, and linking economic development with transportation and housing decisions.The Station Area Plan (SAP) provisions within HB462 advance all four of these strategies as cities lead planning efforts to get the most benefits around our transit station investments. Our March 2022 map of the month presents a list of existing commuter rail, light rail, and bus rapid transit stations, by city, for which SAPs will be developed in the coming years. SAPs will also need to be developed around future stations, before construction moves forward. The map's accompanying graphic illustrates that most all of the SAP planning efforts around these existing transit stations coincide with Wasatch Choice centers and employment areas designated by local government. SAPs are destined to be a very important catalyst toward realizing the Wasatch Choice vision and its quality of life benefits. |
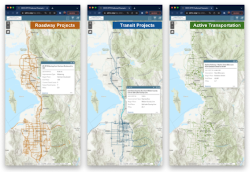 | February 20222023 RTP Preferred Scenario MapEvery four years, WFRC adopts an updated Regional Transportation Plan (RTP) - the long-range plan for roadway, transit, and active transportation projects over the next 20-30 years. This critical work is done in close collaboration with our transportation agency and local government partners.This map shows the 2023-2050 RTP “preferred scenario” - the most recent draft of the list of transportation projects to be included in the next RTP. This preferred scenario reflects consideration of more than 600 comments received from our workshops this past fall with all communities in our region, an interactive public comment map, resource agencies, community organizations, and other stakeholder discussions. In the next few months, WFRC will lead the effort to prioritize and phase projects in the preferred scenario according to each project’s regional performance and the timing of anticipated funding – culminating in an outreach campaign this fall to gather final feedback for the 2023 RTP project list. If you’re curious what changed between the 2019 and the draft 2023 plans, click the “View Changes from 2019 RTP” link. It will take you to an interactive map that compares the two plans. We appreciate your continued feedback and support in refining this list of projects. |
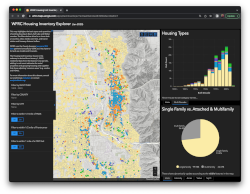 | January 2022WFRC Housing Inventory ExplorerThe more time you spend in a neighborhood, the more familiar you become with that area’s housing options and their characteristics, including the types, ages, sizes, and values of homes. Nevertheless, it’s difficult to get a broader picture of the residential mix and trends for other areas you aren’t familiar with, or the region as a whole.WFRC’s new Housing Inventory Explorer web map shows residential properties in Salt Lake, Davis, and Weber counties, distinguished by the type of housing unit (single family, apartment, condo, townhouse, etc.). It also provides unit-level counts for each type of housing and units per acre, as well as charts market trends across the decades in which current units were built. Better understanding our region's existing housing landscape, and how it interfaces with key transportation infrastructure and other amenities, can help to highlight housing options, trends, successes, and opportunities. This information is especially relevant as developers and policymakers look to respond to growth and affordability-related challenges. As such, cities and counties along the Wasatch Front are encouraged to use this tool when preparing plans such as moderate income housing plans to visualize the existing conditions of housing. The map automatically updates counts and charts as you zoom in on an area, and it allows users to filter for specific counties, cities and ‘built year’ ranges as well as proximity to TRAX and FrontRunner stations, and freeway exits. For optimal viewing, a desktop or tablet-sized screen is suggested. |
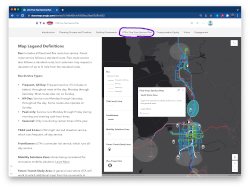 | December 2021Transit Concepts in UTA’s 5 Year Service PlanThis month we are featuring the interactive map of transit service change concepts within UTA’s Five-Year Service Plan. These are ideas for new services, upgrades, and other non-capital/construction intensive changes that UTA is exploring to further enhance regional transit connectivity along the Wasatch Front.Key transit service concepts on the map include corridors for high-frequency, all-day core bus service, peak commuter routes, new transit stations, future microtransit service areas, and areas for near-term transit studies. Keep in mind that the concepts presented are subject to additional analysis and community input before any implementation takes place. The UTA Five-Year Service Plan, adopted by the UTA Board of Trustees earlier this year, sets a goal to revisit the plan every 2 years and lays out the process, timeline, guiding framework, and overall vision for building and updating the plan. All of this is presented in detail within the Five-Year Service Plan website. An additional map accessed from the Vision link in the top-level menu of the Five-Year Service plan website, provides links to detailed information about 28 current studies and projects underway at UTA. |
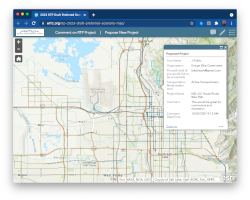 | October 2021Transportation Project Comment Map: Draft 2023-50 RTPEvery four years, WFRC works to adopt an updated Regional Transportation Plan (RTP) - the fiscally constrained plan for roadway, transit, and active transportation projects over the next 20-30 years.The 2023-2050 RTP is coming together and it’s already time for an initial stakeholder review of the list of projects in the first draft of the ‘Preferred Scenario.’ This Fall, WFRC is holding Wasatch Choice workshops with 8 groups of elected officials and staff from Wasatch Front cities. Feedback on the proposed transportation improvement projects is being gathered from workshop attendees. If you have a thought to share after the workshops, or couldn’t attend, our Transportation Project Comment Map shows the draft 2023-50 Preferred Scenario and provides map-based tools to comment on any proposed project, or to sketch in a new project suggestion of your own. Take a look at the map to see what’s planned in your area and let us know what you think. Your feedback is welcomed and appreciated! And, by the way, WFRC and UDOT will co-host similar workshops later this year to gather feedback for the long-range plans in Tooele and Morgan counties, as well. Stay Tuned. |
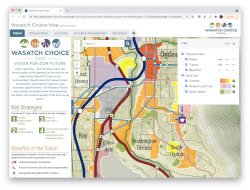 | September 2021Updated Wasatch Choice Centers - A Team Effort!Utah is growing… and we have a plan. The Wasatch Choice Vision is our region’s shared vision for transportation investments, development patterns, and economic opportunities. And we’ve got some exciting news to share: the Vision map has been refreshed to reflect our communities' latest expectations for the future, for coordinating and providing transportation choices, housing options, preserving open space, and economic opportunities.This summer, WFRC coordinated with cities and counties across the region to update center boundaries, names, types, and their expected timing. Here is a link to the updated Wasatch Choice interactive map. If you'd like to see how the centers have changed, the centers boundary comparison map provides a convenient ‘before’ and ‘after’ look. These maps allow you to zoom in and out to see details. About the Wasatch Choice centersBy locating homes, jobs, and transportation - especially transit - in coordination with one another, we can provide real choices for residents to meet their housing, neighborhood, and community preferences. The Wasatch Choice Vision embodies this coordinated approach. In Wasatch Choice, communities have identified centers as effective places to absorb growth.What is a center?A gathering place at the heart of a community that usually:
What are the benefits of “centered” growth?
The Wasatch Choice VisionThe Wasatch Choice Vision reflects the collaboration of many public and private sector partners in our Region, including WFRC and MAG, UDOT and UTA, cities and counties, and more. The Wasatch Choice Vision offers simple, yet powerful strategies for how housing and commercial spaces, the transportation system, economic development, and open spaces can best work together to sustain our excellent quality of life as our urban area continues to grow. |
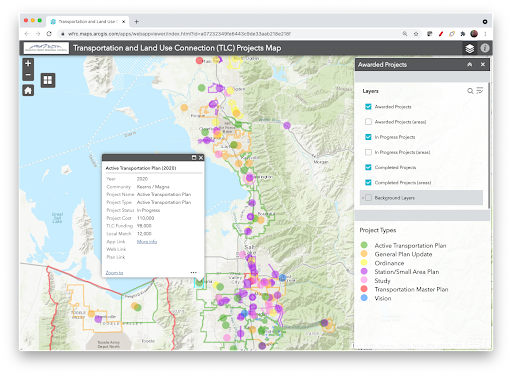 | August 2021Transportation Land Use Connection ProjectsSince 2014, the Transportation and Land Use Connection (TLC) program has awarded $7.7 million for over 100 projects in the WFRC area. You can view all of these projects on the TLC interactive map.Take a look through the map to find what projects have been completed or are underway in your community. Examples include the completed South Davis Active Transportation Plan (awarded in 2018) and the in-progress Midvale State Street Corridor Study (awarded in 2021). The Transportation and Land Use Connection (TLC) program is a partnership between the Wasatch Front Regional Council (WFRC), Salt Lake County, Utah Department of Transportation (UDOT), and Utah Transit Authority (UTA). The program provides planning technical assistance to local communities to achieve their goals, and implement the Wasatch Choice Regional Vision. Have an idea for a TLC project in your city? The application process opens each September so contact Megan Townsend soon for more information. |
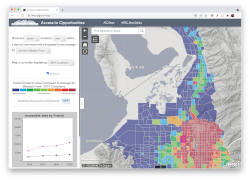 | July 2021Workplace Accessibility Web MapOK, imagine this…• You’re renting or buying your next home and want to consider commute time to job centers as a factor in your decision. • Or, perhaps you’re choosing where to locate a business and want to size up the proximity of potential employees or your customer base at candidate locations. In both cases, and many other planning purposes, WFRC’s new Access to Opportunities (ATO) web map can provide quick insight into our region’s workplace accessibility landscape for both auto and transit travel modes. The ATO map data -- sourced from the regional travel and land use models and available for current years and future projections -- is not new, but the new interactive map format allows us to customize the ATO data relative to different sub areas of the Wasatch Front region. Additionally, the new ATO web map shows how workplace accessibility is anticipated to change at each traffic analysis zone, due to projected changes to nearby land uses, planned transportation projects, and population and traffic growth. Last but not least, users can now select any zone of interest and then turn on the “Travelshed Display” option to see the 10, 20, and 30 minute travelsheds that the travel model is computing for peak period travel. |
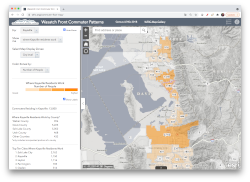 | June 2021City and County Commuter PatternsWhere do a city's residents work?Where do those who work in a specific city live? Our new Wasatch Front Commuter Patterns interactive map provides details to these questions, serving up a close look at the employment landscape and commuting flow between Wasatch Front and Back communities. Select your city of interest -- or a county -- from the list and the map will display the commuter inflow and outflow locations and associated counts at the city, census tract, or census block group level. This map features the most recent (2018) “origin - destination” data from the Census Bureau's Longitudinal Employer-Household Dynamics (LEHD) project, a partnership with the IRS. The LEHD data shown and downloadable from the map, includes all jobs that pay unemployment insurance -- which is thought to be 80-90% of total jobs. As an example of the type of information you can access in the map, for Herriman, 3.7% of its 17,200 working residents are employed in town and 20.8% of Herriman’s residents work within Salt Lake City. For Ogden, the same metrics are 34.4% living and working within Ogden’s boundaries, and 9.2% of its workers commuting to SLC. Good luck exploring the webmap and contact us if you have questions at analytics@wfrc.org. |
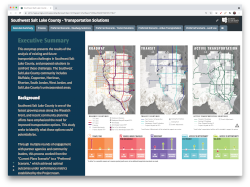 | May 2021Southwest Salt Lake County Transportation StudyThe final recommendations from the recently completed Southwest Salt Lake County Transportation Study are featured in this new interactive map. The study area covers Bluffdale, Copperton, Herriman, Riverton, South Jordan, West Jordan, and nearby unincorporated areas of Salt Lake County.The Salt Lake Valley's SW quadrant is one of the fastest growing areas along the Wasatch Front. This study explored additional and expedited transportation projects -- within the context of evolving land uses -- above and beyond what is currently planned in the fiscally constrained 2019-2050 Regional Transportation Plan (RTP). Through multiple rounds of engagement with community leaders, staff, and transportation agencies, the study process developed a "preferred scenario" set of roadway, transit, and active transportation projects, including new projects that would add an estimated $1 billion in investment, above current regional and local plans. The study's website provides maps, project lists, and projected land use changes for the preferred scenario as well as some of the performance metrics that were weighed during the study process. The Southwest Salt Lake County Transportation Study was funded by UTA, UDOT, Salt Lake County, and WFRC through the Transportation and Land Use Connection (TLC) Program. The new projects identified in the preferred scenario will be considered for inclusion in the next RTP update, which is scheduled to be completed for adoption in 2023. |
 | April 2021Planning Data Treasure Map (?)‘X marks the spot’ is a fitting synonym for #WhereMatters, the unofficial hashtag of the Wasatch Choice regional vision. Where are the best locations to attract workplace and housing development? How can a new pathway or trail connect into the existing or planned network in neighboring areas?As your community works to best position itself for growth opportunities and challenges, it’s key that staff and consultants have the most current regional information resources at their fingertips. This month’s “map” is an easy-to-use treasure map to those resources -- an up-to-date list to find and access the map-based GIS and other data, specific to our region, that is ready to be put to work to support transportation, housing, economic development, recreation, and other quality of life planning. Over 50 datasets are currently included in the list, such as: growth projections, funded and planned transportation projects, active transportation plans, economic incentive areas, the latest aerial photography, and much, much more. Is there other information that would be helpful to you as you plan your communities? Let us know! Contact analytics@wfrc.org. |
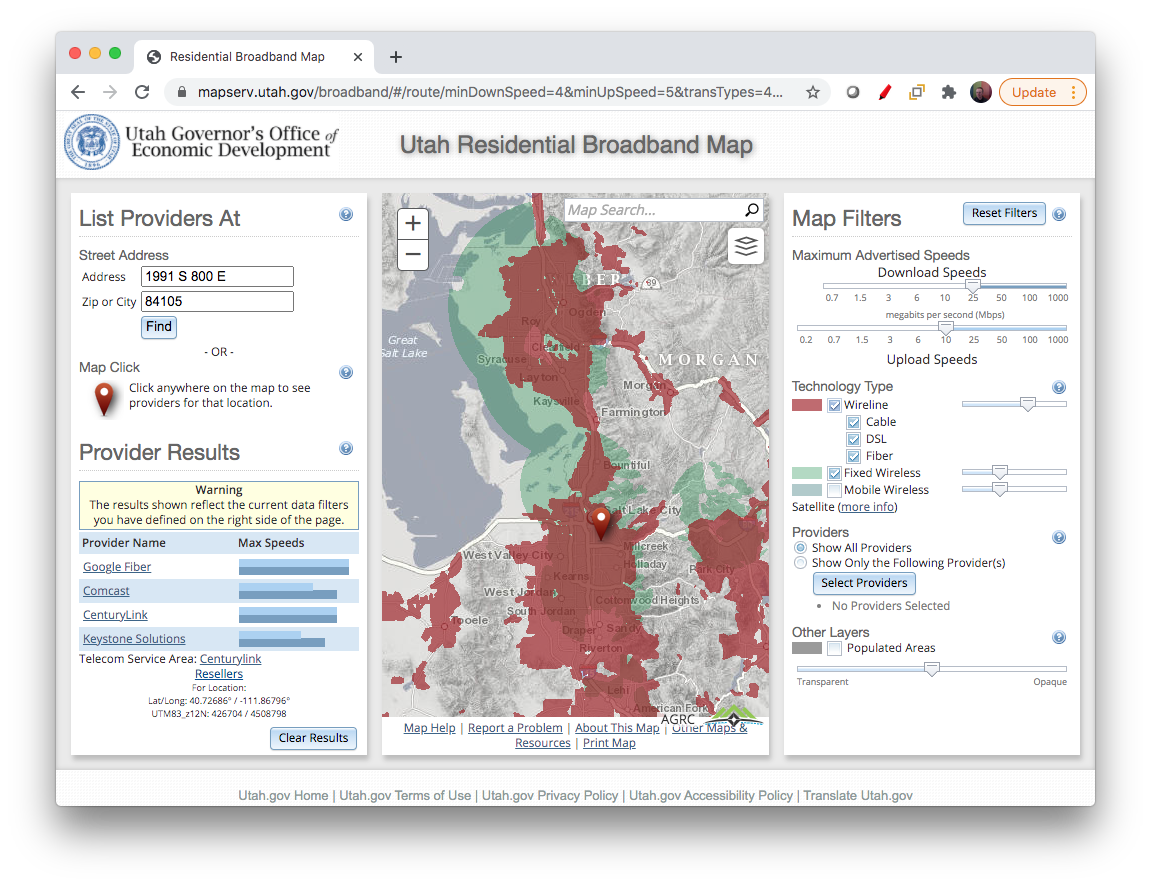 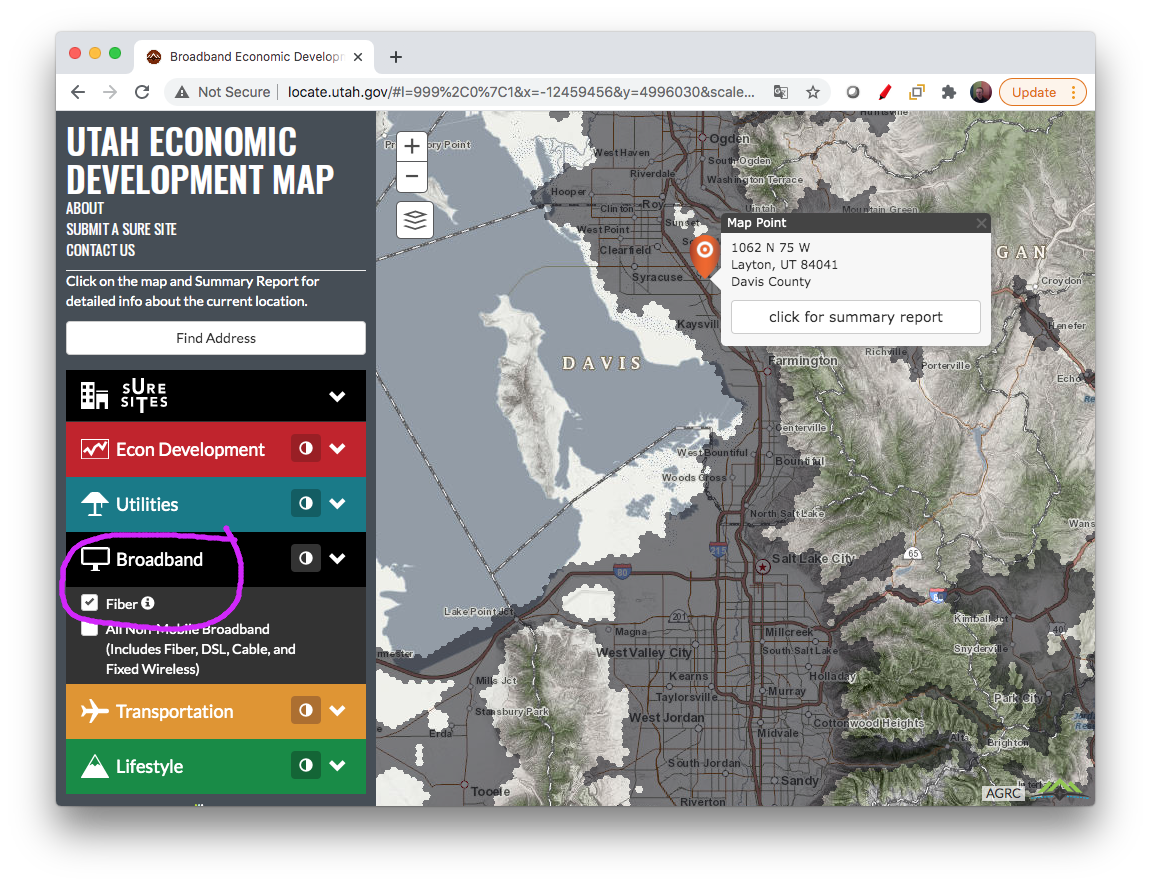 | March 2021Utah's Broadband LandscapeIf you didn’t think high-performing broadband options were important before the COVID-19 era, you’ve probably recently changed your mind. And, it’s almost ‘a given’ that broadband will continue to provide important connections to work, education, and basic services going forward. This month’s WFRC Map of the Month post features two existing maps that illustrate Utah’s broadband landscape at a very detailed level.The first map, the Utah Residential Broadband Map, shows the speeds, providers, and service technologies available across Utah. You can filter by any of these factors or just type in an address to see what’s available. The link above opens the map with its filter preset to show non-mobile services with at least 25 Mbps download and 10 Mbps second upload -- a good threshold for work-at-home. HB 348, passed during the Legislature’s 2021 general session, creates a new Utah Broadband Center within the renamed Governor’s Office of Economic Opportunity (Go Utah, formerly GOED) and an accompanying grant program for broadband projects that impact Utah’s un/under-served areas. Another project of GO Utah and their mapping partner UGRC, the Utah Economic Development Map, opens to show where businesses can expect to easily obtain a fiber-based broadband connection. This is just one of the layers that show the geography of what’s important to business. Other key site selection layers include major transportation corridors, utility providers, incentive zones, and community amenities such as recreation, higher education, and healthcare destinations. Enter an address or click the map to generate a site-specific report across all the layers. |
 | February 2021Street ConnectivityGridded streets or otherwise highly-connected road networks respond better to peak period travel and, in general, make it safer and more convenient to walk or drive to nearby destinations.Our February Map of the Month presents a brief exploration of how well the surface street network is interconnected along the Wasatch Front and Back. The map identifies how different areas of our region compare using intersection densities and other methods from the 2017 Utah Street Connectivity Guide and provides links to the GIS data that is shown. In addition to creating a more efficient transportation system, street connectivity can help improve a wide range of community aspects reaching into safety, health, economic vitality, the environment, and quality of life. |
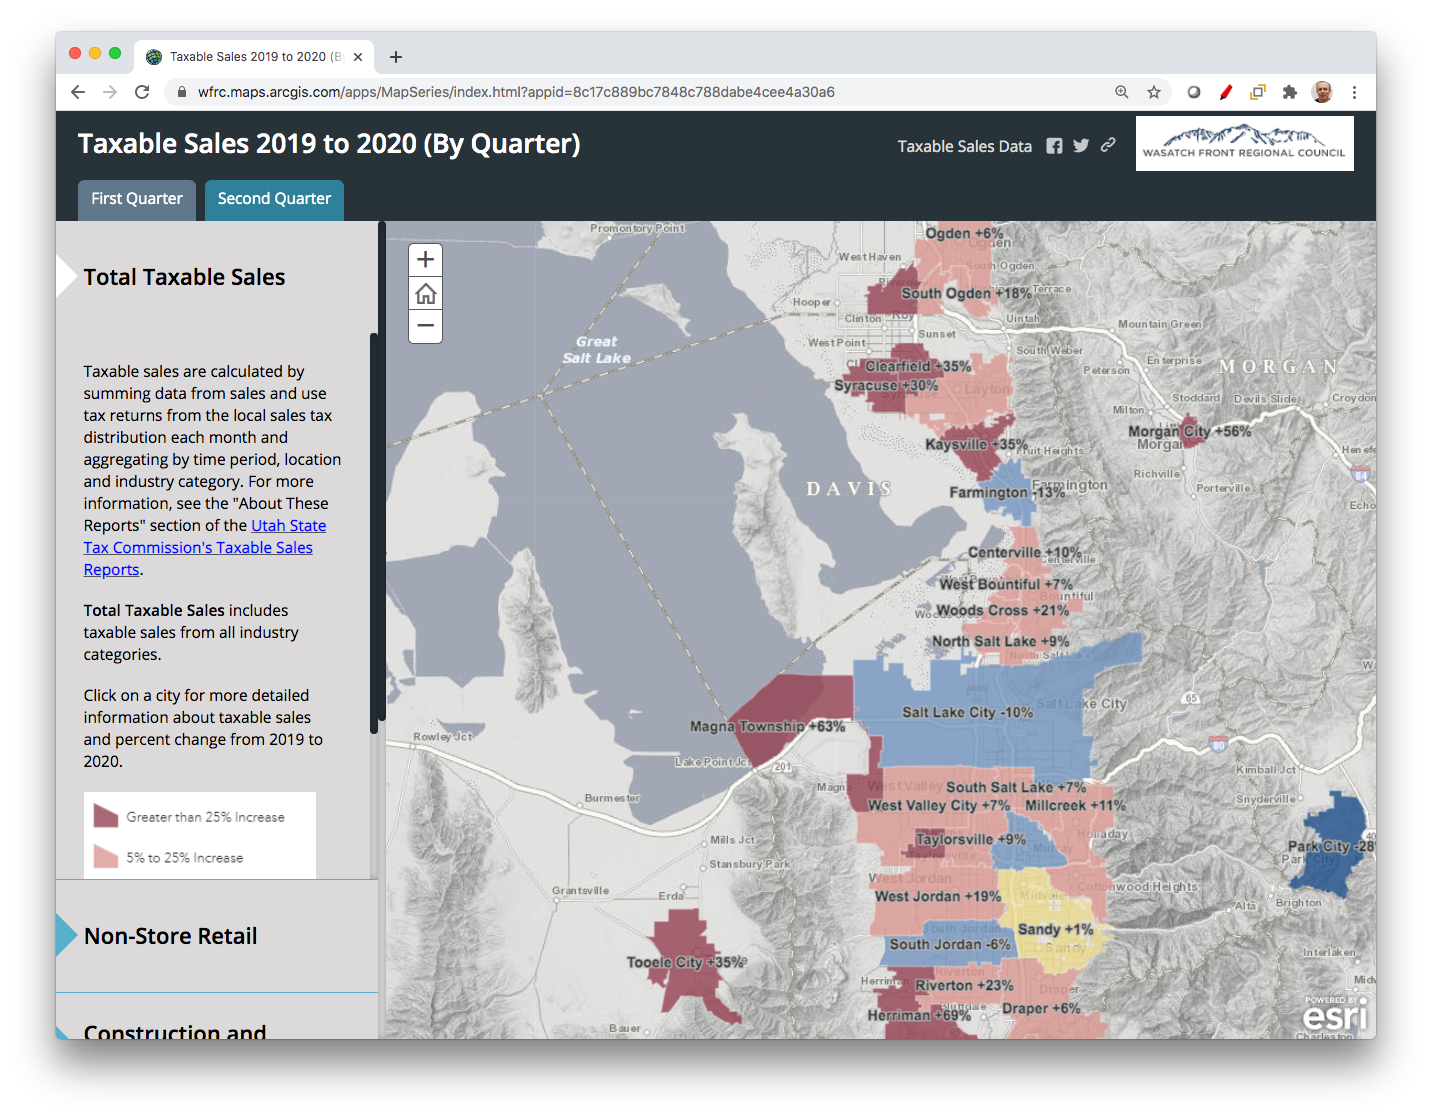 | January 2021City-level Sales Tax Trends During Covid (2020)The imprint of COVID-19 on our local economies and regional retail patterns is readily apparent in taxable sales reported across different Utah cities and business sectors. The good news is that it is not all bad news...but it is interesting!WFRC's January Map of the Month compares year-to-year taxable sales between 2019 and 2020 using data reported quarterly to the Utah State Tax Commission (USTC) for mid and large-sized cities. There's a lot of insight to be found in the taxable sales data, especially in the second (April-June) and third (Jul-Sep) quarters. Putting this data map form makes for easier comparisons within our region. On the whole, taxable sales -- and accompanying sales tax revenues that fund everything from municipal and state services to road projects and transit operations -- have increased slightly in 2020 as Utah continues to grow. But this is certainly not true for every city, and definitely not true for every sector. The interactive map highlights several business sectors that exhibit dynamics of COVID era, are directly relevant to transportation funding, or both. These include Non-Store Retail (internet sales, etc.), Restaurants and Bars, Retail Auto, Construction and Building Supply, General Retail, and Gas Stations. Online shopping, a home improvement surge, and work-from-home-shop-near-home are just some of the trends that can be explored. We'll plan to add additional quarterly data to this map as it becomes available from USTC. |
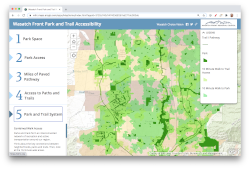 | December 2020Park and Trail AccessibilityPublic parks and trails form an interconnected network of recreation and active transportation opportunities for Wasatch Front residents.Our December map of the month spotlights park space, family-friendly pathways, and the accessibility of these critical assets using 10 minute walk sheds around parks and trailheads. This map series can help us understand our current strengths and where additional resources may be needed as our demand continues to grow in our region. For more information contact Nicole Mendelsohn. |
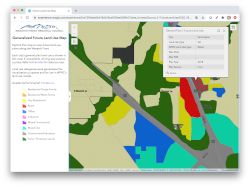 | November 2020Generalized Future Land UsePlanning for our best transportation future must be done in close coordination with the future land uses envisioned in local government plans.With help from two University of Utah students, WFRC staff have developed this generalized future land use map that summarizes the designated land uses in the general plans of over 50 cities, towns, and townships in our region. While this map layer is not a substitute for the detailed local plans available directly from cities, it presents consistent, region-level context in the form of common land use types, ex. single-family residential, mixed use, and parks/sensitive lands, etc. Thanks to city planners and GIS staff across our region for making your future land use information available! If you have general plan updates to share or would otherwise like to work with WFRC to provide feedback, please contact Matthew Silski |
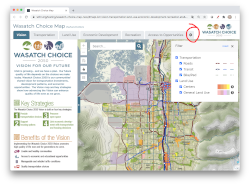 | September 2020Wasatch Choice Map & UpdatesWith the Wasatch Choice web map you can explore the vision for what our region's transportation system and land uses will look like in 2050. But there's more to it than that - along the top of the web map, you can explore the major projects, land use goals, economic development and other factors that are planned toward realizing the broader vision.And new this month, there are even more map options to choose from within the Wasatch Choice map including TLC Projects, near-term, funded TIP Projects, the Active Transportation network, and Growth Projections. These additional maps can be added and reordered anytime you want from the new map settings control - just click the gear-shaped icon (shown circled in red above). |
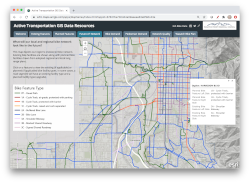 | August 2020Active Transportation GIS Data ResourcesBuilding on the work of so many WFRC partners, the first comprehensive bicycle and pedestrian maps and datasets are now available for the Wasatch Region! Our new Active Transportation GIS Data Resources web map allows you to view and explore all of this newly available active transportation (AT) information from the comfort of your favorite browser. This information is more important than ever, as bike use has increased by nearly 100% during the pandemic, and our region is likely to see lasting gains in biking for commuting and for recreation.Each tab of the map offers a different view of the AT network, including:
|
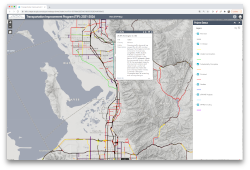 | July 2020Transportation Improvement Public Comment MapWasatch Front Regional Council along with our partners, Utah Department of Transportation (UDOT) and Utah Transit Authority (UTA), identified hundreds of priority transportation projects that aim to enhance mobility, strengthen the economy, connect communities, increase access to opportunities, and improve health along the Wasatch Front. These projects, totaling $3.4 billion in federal, state, and local funding, were listed in a draft of the 2021-2026 Transportation Improvement Plan (TIP) for public comment.As part of the WFRC process to formalize funding commitments to these projects, an interactive map was created to explore the projects' locations and details. The map also provided an easy tool for submitting comments generally, or for any specific project. Comments received helped to inform the approval process for the TIP. The deadline for TIP comments was August 8th, 2020. [Since the 2021-2026 TIP was been adopted by the Council in August 2020, we are providing a link to the most current TIP project interactive map here instead] The Transportation Improvement Program includes roadway, transit, bicycle and pedestrian projects identified for funding over the next six years in Salt Lake, Davis, Weber, Tooele, and Morgan counties, and the urbanized portion of Box Elder County. The projects vary greatly in scope, amount of investment, and stage of development. For example, there are new freeway interchanges on I-15 that are scheduled to begin construction in 2023 or 2024. On the other end of the spectrum are minor road widenings that include pedestrian and cyclist improvements, in communities across the region including Harrisville, West Point, and Murray, some of which are already under construction. Likewise, transit projects range from the new Ogden-Weber State University bus rapid transit line, to rail operation and maintenance programs, and funding for electric bus charging infrastructure for UTA’s emerging electric bus fleet in Weber and Salt Lake Counties. For more information regarding the TIP, please contact Ben Wuthrich, Transportation Improvement Program Coordinator. This new viewer allows you to look at future years as well as changes in volume between years. Selecting any road summary segment from the county-based dropdown lists will graph out the history and volume for any modeled road. All volumes shown are expressed as Average Annual Daily Traffic (AADT) counts, but seasonal and other volume adjustment factors are also accessible from this web map and its accompanying downloadable datasets from data.wfrc.org. |
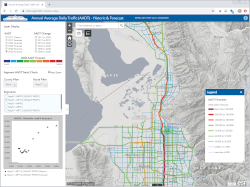 | June 2020Traffic Volume History & ForecastsThe WFRC Traffic Volume Webmap allows anyone to access forecasted and observed data for most major roads across all of Utah. The forecasted data was developed and compiled by UDOT and the Utah's four metropolitan planning organizations (Cache, Dixie, MAG, & WFRC).This new viewer allows you to look at future years as well as changes in volume between years. Selecting any road summary segment from the county-based dropdown lists will graph out the history and volume for any modeled road. All volumes shown are expressed as Average Annual Daily Traffic (AADT) counts, but seasonal and other volume adjustment factors are also accessible from this web map and its accompanying downloadable datasets from data.wfrc.org. |
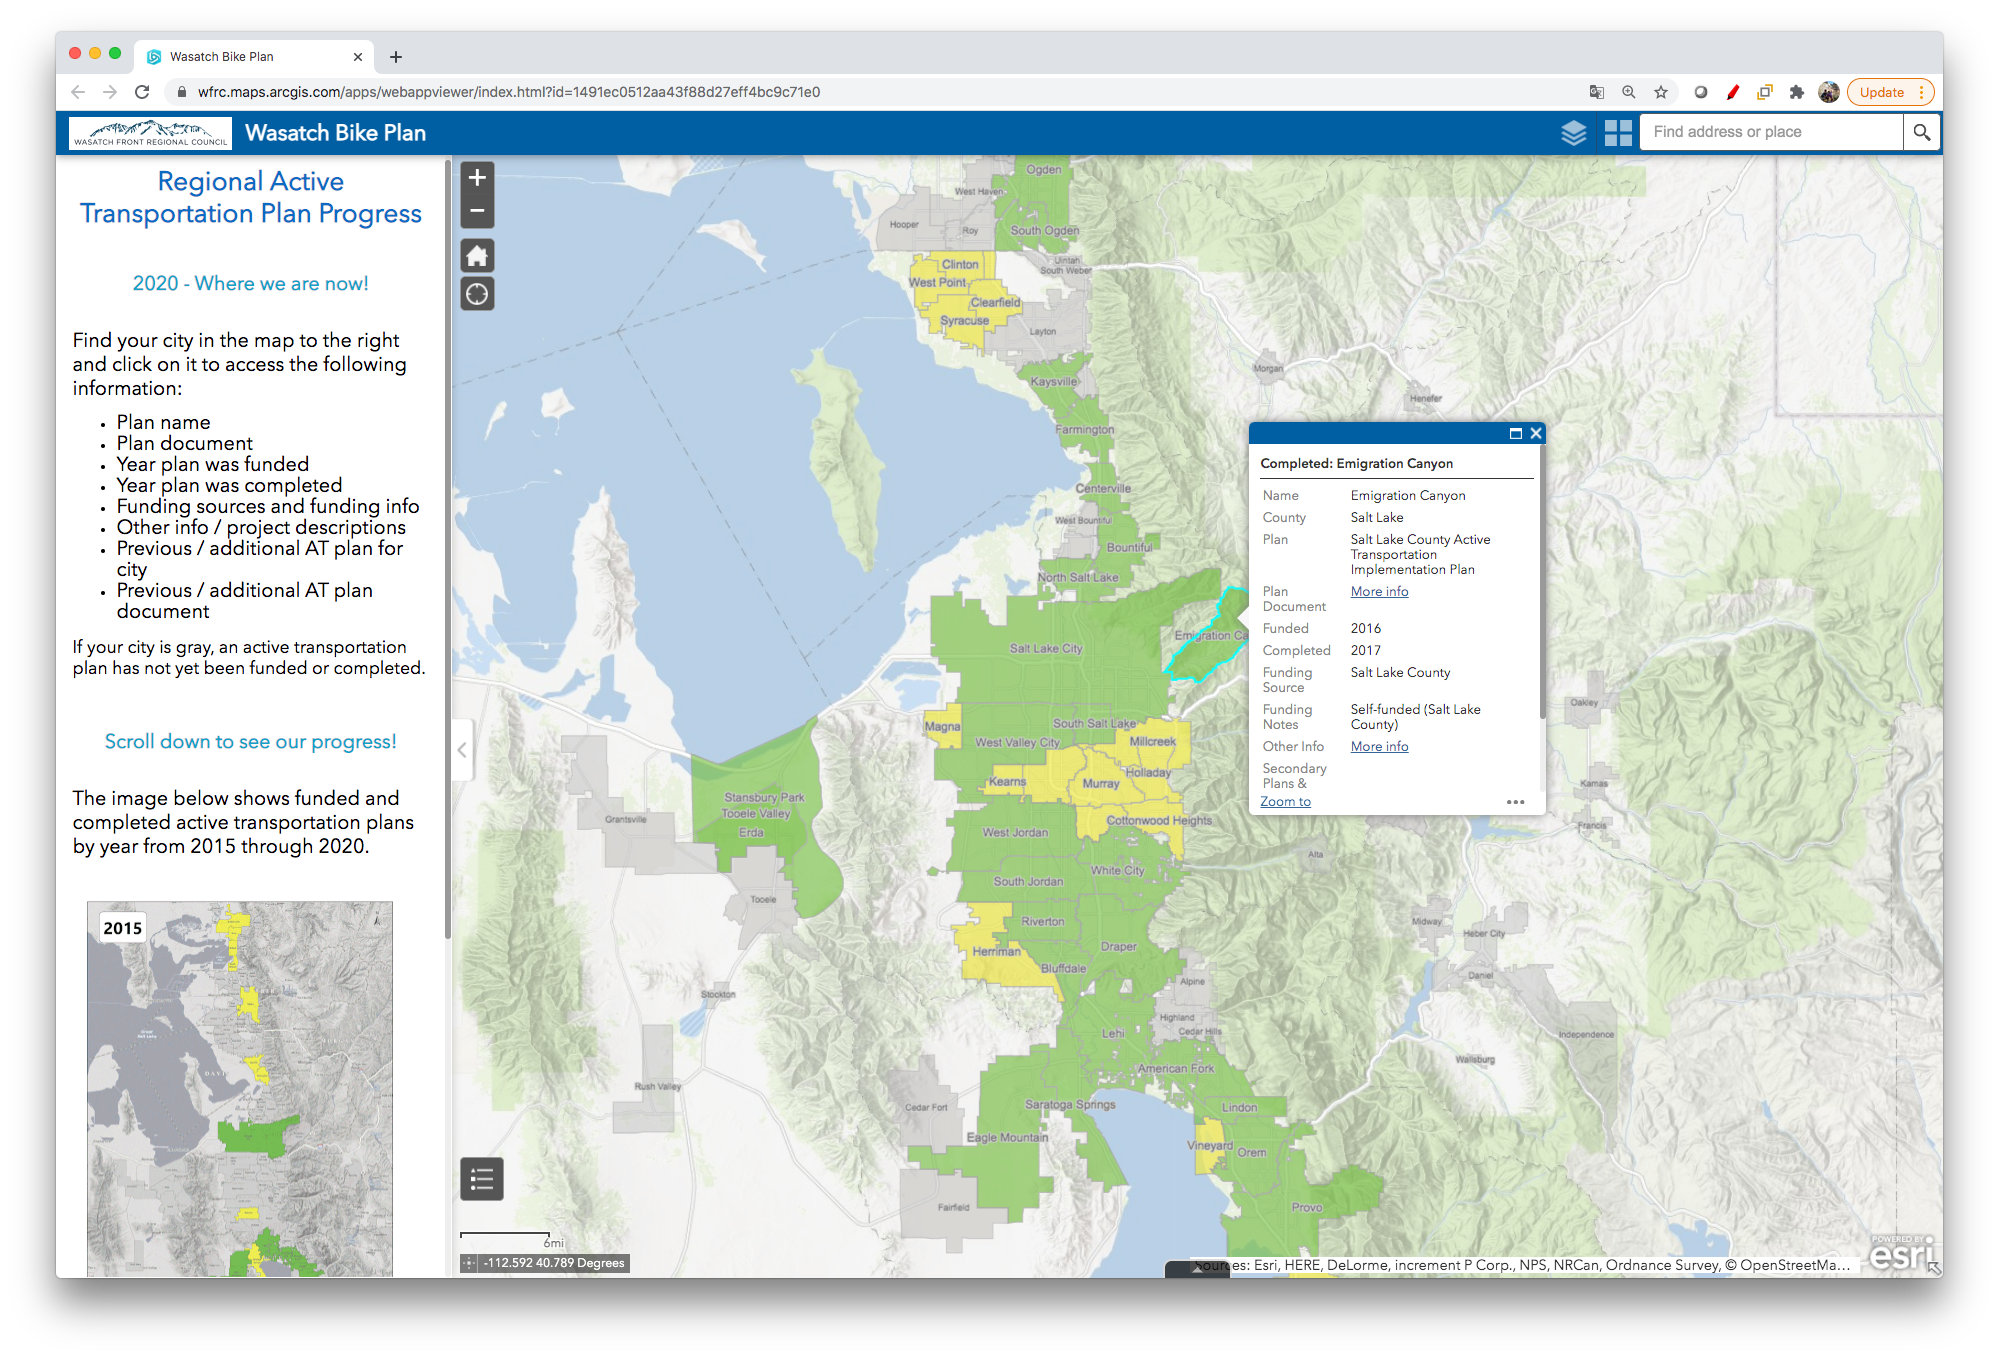 | May 2020Wasatch Front Bike PlansMore people around our region are using biking as a means of transportation and enjoyment. Also, cities are now required by law to include an active transportation component in their transportation element within their General Plan. Great progress is being made to plan and develop safe and comfortable bike routes in communities around our region.Did you know that 74% of communities in the Wasatch Front Regional Council (WFRC) area have completed or been funded for an active transportation plan? Wasatch Front communities continue to make speedy progress toward prioritizing safe, connected bicycling routes through the development and adoption of Active Transportation (AT) plans. With this new interactive map, developed by Wasatch Front Regional Council and hosted by Bike Utah, you can easily check the status of AT planning in your area, access completed plan docs and maps, and information about funded plan development projects. The map shows communities with completed AT plans (green) and those with funded projects for AT plan development (yellow). Click anywhere on the map to access more information about any of the AT plans as the map links to completed plans and details about AT planning projects in progress. You can also view the impressive AT planning progress in our region over the last 5 years, -- scroll down on the left sidebar to watch the animation! If bikes, data, and maps are your thing, you may also want to check out this update on new and forthcoming bike-related GIS data resources. This map is also available through Bike Utah's web page. |
