A basic purpose of our transportation system is to efficiently connect residents to activities and destinations. Access to opportunities, also referred to as accessibility or ATO, is a way to measure how well people can connect to basic needs and amenities including jobs, schools, grocery and other retail, parks, community centers, recreation, and entertainment.
Measuring current and future ATO is an important component to both the development and implementation of the Wasatch Choice Vision for our region. Broadly, ATO metrics quantify how well the current and future transportation system works with land use to help our economy thrive.
More directly, increased accessibility can have significant impacts on overall community livability while improving individuals’ connections to the things that foster upward mobility — education, employment, healthcare, social service, and other basic amenities. ATO serves as a guide for WFRC and its partner organizations, as we collectively pursue the best possible transportation plans and land use decisions in support of community choice and economic vitality.
ATO can be assessed using a variety of frameworks and scales.
Regional Access to Opportunities
- At a regional scale, Access to Opportunities is a metric that can be estimated and forecasted using the regional Travel Demand Model, and the results can be visualized in map form using geographic information systems (GIS).
- WFRC developed the GIS-based ATO Impact Tool to calculate simpler ATO gain metrics for small and medium-sized transportation and land use projects. The ATO Impact tool make use of ArcGIS Pro’s network analyst and open-sourced python notebooks, together with a multimodal transportation network and TAZ-based household and job intensity, and simplified assumptions about how new projects change workplace accessibility measures. For more info about this tool, contact analytics@wfrc.org.
- WFRC’s ATO TAZ-based measures combine the performance of the transportation system during rush hour, and factor in the distribution of households and workplaces around the region.
- ATO describes the efficiency of how metro area residents travel between home, work and other desired destinations.
- ATO can be used to describe key labor market components – the average number of jobs that are reachable to a resident within a set travel time, or the number of employees or households a firm or business might draw if located within a specific place. In both cases, the pattern and intensity of development and the transportation system have a significant impact.
- Both shorter travel times and an increased presence of employment and other opportunities result in higher accessibility scores. Travel times can be shortened by improving one or more of the following: proximity of destinations to homes, enhanced transit service, or a reduced road congestion.
- WFRC land use and travel models allow for the accessibility impacts of land use decisions and transportation enhancements to be forecasted and explored a decade or more into the future.
Local Access to Opportunities
- At a local scale, where an individual city or neighborhood is considered, Access to Opportunities can be measured in finer detail than the regional Travel Demand Model provides, and can consider additional travel modes such as biking and walking.
- Local accessibility metrics consider a wider range of destinations including the locations where important goods, services, and activities can be obtained. In short, this is the ease with which we can reach existing amenities that help support livability, such as grocery stores, health care facilities, parks and public spaces, or a transit stop that links residents to employment, goods and services. Accessibility in this sense is best where there is a mix of land uses at the neighborhood scale, good street connectivity, and a safe walking environment.

Access to Opportunities (ATO) metrics are a family of measures that describe how well the region’s household, employment, and goods/service locations are connected to each other by the transportation system. WFRC has developed several methods to quantify ATO within the region and is working on a few additional measures.
TAZ Zone-Based ATO
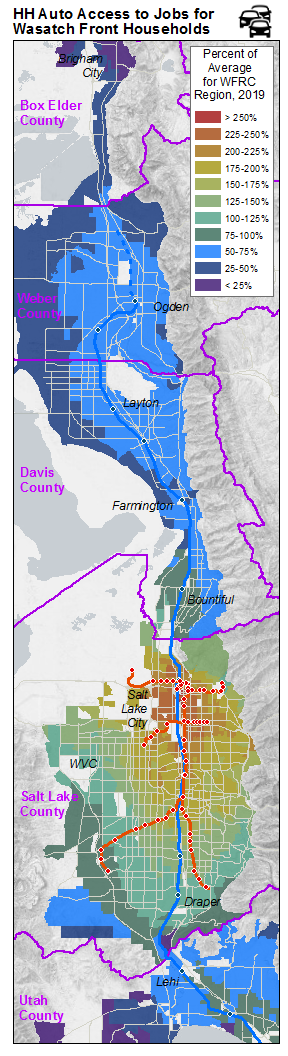
The two maps at right show regionwide ATO metrics for 2019, calculated for both auto and transit modes at the traffic analysis zone (TAZ) level. The TAZ-based ATO metrics consider 1) our region’s distribution of households and jobs, 2) travel time to the workplace during the peak commute hours, and 3) an inverse weighting of opportunities that fully counts those that are nearby and a discounting for others in proportion to how far way they are. The Cube Voyager script for calculating TAZ_based ATO is built into the Wasatch Front travel demand model (v8.3.1) and employs mode-specific distance decay functions that reflect regional travel patterns.
These maps show a composite view of workplace accessibility. Composite ATO allows the accessibility for residential areas to be viewed on equal footing as job-intensive areas, by combining household access to nearby jobs together with workplace access to members of the labor force into a single metric. This is accomplished by scaling job area measures to household area measures using the region’s jobs-to-household ratio.
The same TAZ-level ATO data can be normalized within a smaller area to better see local variation in accessibility. Expand any of the three Small Area Workplace Accessibility Map sections below to view accessibility from a city-scale perspective. Maps are available for existing ATO (2019) and projected future ATO (2050) that account for socioeconomic growth and infrastructure projects planned in the 2019 – 2050 Regional Transportation plan (RTP). A third series of maps shows the net gain in ATO between 2019 and 2050.
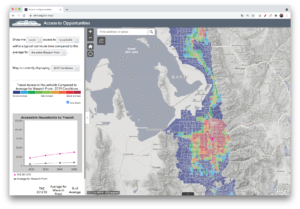
ATO Web Map
TAZ-based Access to Opportunities (ATO) data can now be accessed from the WFRC ATO webmap. The web map also displays a trend line for each TAZ that factors in future land use and transportation system performance at that location relative to the regional average. The ATO webmap now has the ability to display ATO adjusted for subsets (ex. Northern Davis County) of the Wasatch Front that was previously available in static PDF maps.
Grid-Based ATO
WFRC developed a grid-based Access To Opportunities map layer for the region to support a portion of the scoring system used to prioritize local transportation projects for funding programmed by WFRC as part of the Transportation Improvement Program (TIP).
This grid-based ATO metric, termed Commute Source Intensity, considers both job and housing densities within approximately 1/4 mile of a project of each grid cell. The grid-based approach — wherein each cell is about the size of a downtown city block — is a simple, easy to understand method that is appropriate for local scale analysis. The Commute Source Intensity GIS polygon dataset available for download from data.wfrc.org.

Network-Based ATO
WFRC has collaborated with Mountainland Association of Governments (MAG), UDOT, UTA, and UGRC (Utah’s state GIS office) to create and sustain a multimodal GIS dataset of the transportation network, including roads, transit, and bike lanes, and bike/ped pathways.
The multimodal network dataset, together with GIS data depicting the location of schools, groceries, community centers, health care and social service providers, and parks, are used in ATO analysis at a neighborhood scale.

Housing ATO Calculator
The Housing Access to Opportunities (ATO) Calculator can assist housing and land use planning efforts throughout the greater Wasatch Front. This tool is intended to be used as a conversation starter, helpful visualization, and data-informed guide about access and planning for housing opportunities.
Users choose what factors are important to their community and prioritize them. The tool produces a heat map of most to least suitable locations based on the user’s prioritization.

Our work with ATO and WFRC Community Focus Areas is featured on the Community Planning page.
ATO can help us see gaps between residents and employment opportunities and other basic needs at a neighborhood-level.
There are many ways to communicate ATO at various scales and through different demographic or employment lenses.
Overall, the level of accessibility varies significantly across our metropolitan region. For example, the average household can access around 33,000 jobs in a 30 minute transit commute within the Wasatch Front region; 57 percent of the region’s population has “less than average” access to opportunity, while close to 30 percent of the population has access to one and a half times the regional average within a 30 minute commute. This is due to the spatial distribution and intensity of households, jobs, and the reach and frequency of the transit system.
The number of jobs accessible to Wasatch Front households by a typical length auto commute varies greatly across the region. And the variation is even great for typical transit commute lengths.
Many of the maps available on this web page show the geographic distribution of access to jobs. The charts below, analyze these map-based ATO metrics, counting the number of Wasatch Front households that experience different levels of access to jobs, by auto and transit, in our region. Maps showing the distribution of households from each of the chart bars are also available for auto and transit.

Methodology Notes: the charts above were compiled from TAZ-based household access to job metrics for 2019 (the JobAuto19 and JobTransit19 attribute columns). TAZs without households (e.g. undeveloped areas, industrial areas, etc) were excluded from the analysis. The regional average TAZ score, was calculated after weighting populated TAZs by household count. Google sheet for the calculations and charts.
The following maps examine two local neighborhoods to understand the types of destinations a person walking can easily access. The map on the left displays a one-mile walk-shed buffer around Murray’s FrontRunner station, and the map on the right is a one-mile walk-shed from Farmington’s FrontRunner station. The walk-shed is calculated utilizing the existing street network, and takes into account connectivity under or over barriers such as I-15. In Murray, there are three local streets that permeate I-15, providing east-west connectivity, whereas in Farmington, there are only two local streets that allow people to pass under I-15. Residential areas just east of I-15 are not able to efficiently access the station (shown by a black dot) within the allotted walk shed distance or the goods and services within the one-mile buffer. These examples underscore the importance of street connectivity in supporting access to opportunities by broadening an area’s walk-shed.
Additionally, you can see that both areas have a diversity of destinations within the one-mile buffer. In Murray, while the street network is dense and gridded, destinations are slightly further apart. Conversely in Farmington, the street network is not as robust and there are large parking lots between destinations, but the destinations themselves are clustered. There are parks and/or open spaces within both one-mile station buffers. Planners and local leaders can use this type of resource mapping to understand amenities that may be missing from areas within their community, and the types of businesses or services that they might encourage in order to provide a variety of options for residents and support a greater quality of life.
 and Farmington Station (right).")
An Access to Opportunities measure can facilitate decision-making for and beyond transportation planning. For example, the measure can also be useful in home purchasing, businesses or government facilities site selection, and in supporting upward socioeconomic mobility. Cities and developers can improve access to opportunity in myriad ways, such as mixing uses and clustering growth near high speed and high frequency transit.
Land-use solutions that improve Access to Opportunities include:
- Growth centers near high-capacity transportation,
- Higher densities,
- Intermixing homes and jobs, and
- Street design that encourages local investment along the street.
Transportation solutions that can improve Access to Opportunities include:
- Reduced congestion,
- A more connected street network,
- Increased transit frequency and coverage,
- Bicycle and pedestrian connections, and
- Higher travel speeds on key commuter (non-neighborhood) routes.
Since 2017, WFRC has made a significant effort to operationalize Access to Opportunities (ATO) measures to better link transportation, land use, and economic development. These include:
- A performance-based planning system was defined and implemented for the 2019-2050 Regional Transportation Plan. As a result, ATO metrics were incorporated into scenario evaluation and project prioritization scoring for roadway, transit, and active transportation projects.
- ATO was approved by Trans Com, starting in FY19, as a component of project technical scores (15%) for Surface Transportation Program project funding that is competitively awarded by WFRC.
- The Wasatch Front Economic Development District (WFEDD) adopted Access to Opportunities as a key economic development strategy. It is expected that ATO metrics will be monitored over time to gauge progress within the region.
- The ATO framework and supporting data resources continue to be a focal point for workshops and other WFRC outreach efforts with cities and counties in our region.