Compare Model Results

This section compares the model results between version 9 and version 8.

Road Volume Comparisons

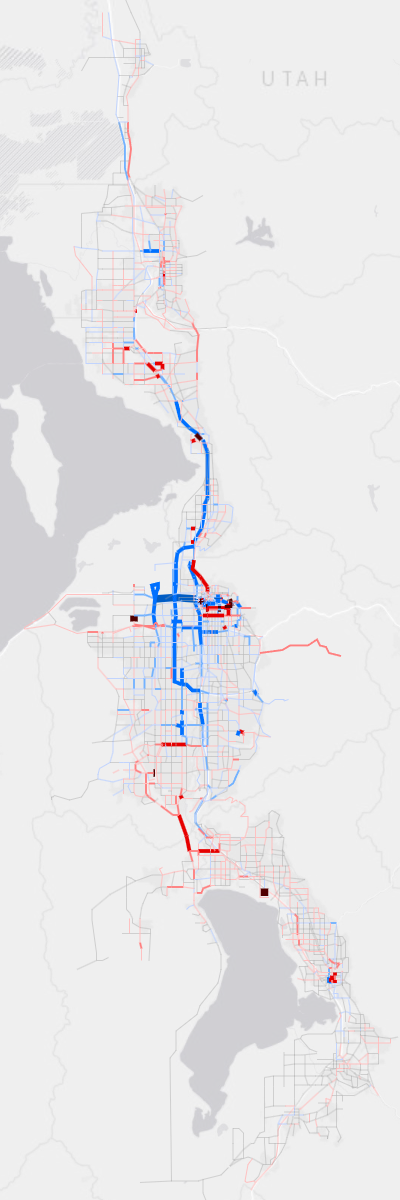
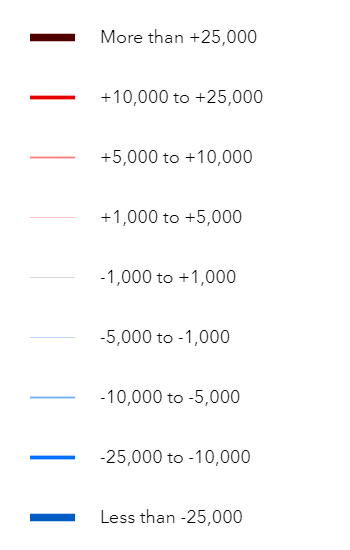
The comparison between daily volumes at the segment level can be found in Figure 1 for 2019 and 2050. Decreases in volume in version 9 compared to version 8 are shown in blue, while increases are shown in red.

For 2019, Salt Lake and northern Davis counties display a drop in roadway volumes, most apparent on I-15. Weber, southern Davis, and Utah Counties show increases. Most of the changes are relatively minor, with the largest decreases occurring on the freeways in Salt Lake County. However, given the large daily volume for these roadways, the percent change is relatively low.

For 2050, there are decreases in volumes on I-15 in Salt Lake and northern Davis counties. Weber and northern Davis counties show overall increase in roadway volumes. Utah County shows the most change with the two Utah Lake crossings not part of the 2050 fiscally constrained scenario. The resulting drop in volumes is evident with increases on I-15.

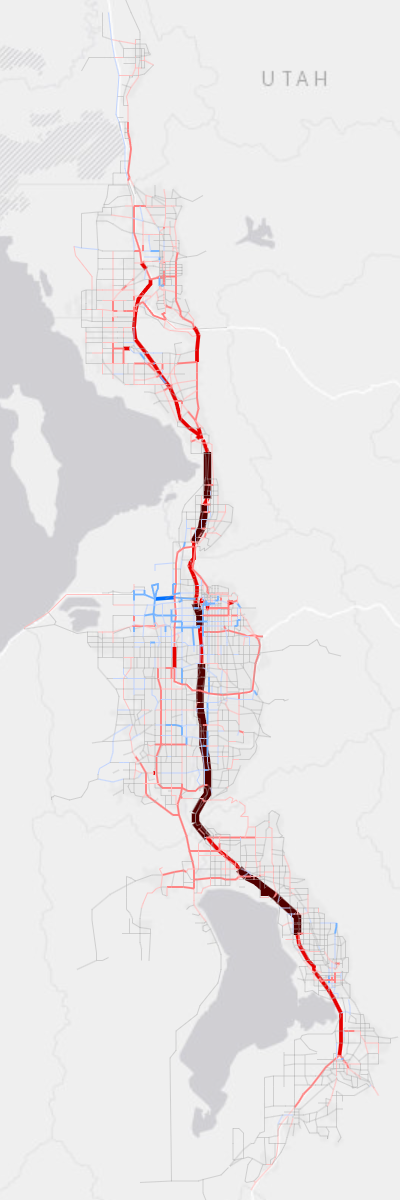
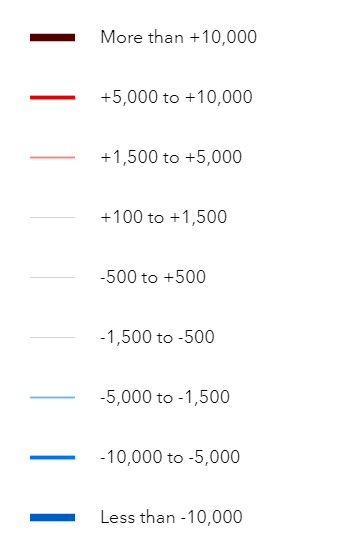
The comparison of daily medium and heavy truck volumes is found in Figure 2 for 2019 and 2050. Truck volumes decreased in the northwest portion of Salt Lake County.

(a) 2019

(b) 2050 Fiscally Constrained

Figure 1: Model Daily Volumes Comparison - All Vehicles (version 9 vs version 8)

(a) 2019

(b) 2050 Fiscally Constrained

Figure 2: Model Daily Volumes Comparison - Trucks (version 9 vs version 8)

Transit Comparisons

Transit comparisons were done with ridership, trips mode share, and boardings mode share. Overall ridership increases significantly in version 9, and Core Bus ridership takes a larger share of trips and boardings than in version 8.

Transit Ridership

Transit ridership in version 9 compared to version 8 shows significant increase in 2032, 2042, and 2050. See Figure 3 through Figure 9. The total ridership in 2050 for version 9 is 327,000 daily trips compared to the version 8 model that showed 258,000 daily trips, which equates to 26% more trips. The additional trips is largely due to the improvements in commuter rail with increased frequency and speed together with the change in the model sensitivity to changes in headway.

Transit ridership by modes are shown in the following set of figures. Light-Rail Transit sees an increase through 2028 and then a large decrease in 2032. This large decrease can be explained by the shift of riders from Light Rail to Core Bus routes, with a large number of core routes coming online in 2032.

Figure 3: Daily Transit Ridership - All Modes
Figure 4: Daily Transit Ridership - Commuter-Rail Transit
Figure 5: Daily Transit Ridership - Light-Rail Transit
Figure 6: Daily Transit Ridership - Bus Rapid Transit
Figure 7: Daily Transit Ridership - Express Bus
Figure 8: Daily Transit Ridership - Core Bus
Figure 9: Daily Transit Ridership - Local Bus

Transit Share

A comparison of the share of trips amongst the various modes of transit was done for both Trips and Boardings.

The transit ridership trip shares by mode can be found in Figure 10 for version 9 and Figure 11 for version 8. The main difference in version 9 trip share by mode is the large increase in Core Bus trips in 2032 from almost nothing in 2028, while in version 8 the increase in Core Bus trips is spread out between 2024 and 2030. This large increase is consistent with the transit inputs into the model with a large number of Core Bus routes coming into production in 2032, replacing mostly local bus service. The new Core Buy takes most of the local bus ridership it is replacing, but also quite a lot of ridership from Light Rail Transit (Mode 7).

Transit boardings for version 9 are found in Figure 12 and for version 8 are found in Figure 13. Boardings follow the same pattern as trips, but boardings are able to differentiate between modes better than trips that are categorized hierarchically.

Figure 10: Transit Trips Share by Mode - Version 9
Figure 11: Transit Trips Share by Mode - Version 8
Figure 12: Transit Boardings Share by Mode - Version 9
Figure 13: Transit Boardings Share by Mode - Version 8

Commuter Rail Station Boardings

The comparison of base year (2019) station-level boardings for commuter-rail transit (CRT) is found in Figure 14. CRT boardings were found to be higher than observed for Davis County and lower than observed for Utah County. An adjustment of 5 additional minutes to in-vehicle-time for trips to/from Davis County and 5 fewer minute to in-vehicle-time for Utah County was made to attempt to bring the model more in-line with observations.

Additional investigation was conducted into why Provo and Lehi were particularly low in the model. The findings did not turn up any obvious errors in the transit or model network. So, the conclusion is that further adjustments to CRT will be possible in the Mode Choice Update project that is currently being undertaken for the next release of the model.

Figure 14: 2019 Daily CRT Boardings by Station - Model vs Observed