2022-02-04 Update
This first part of this document contains a quick comparison between the 2022-02-04 version of the model and the 2021-11-10 version of the model.
Changes
The following changes were made the Distribution and Final Assignment scripts of the model
- Changed truck penalty from speed factor to a speed reduction penalty
- Updated toll calculations:
- Update COST function
- Update TC function
- General model cleanup
Additionally the Scenario Folder was updated with updated default ControlCenter.block files, a rolled date of model version, Fixed Cluster START & STARTHIDE typo, and added ‘blank folder setup’ folder.
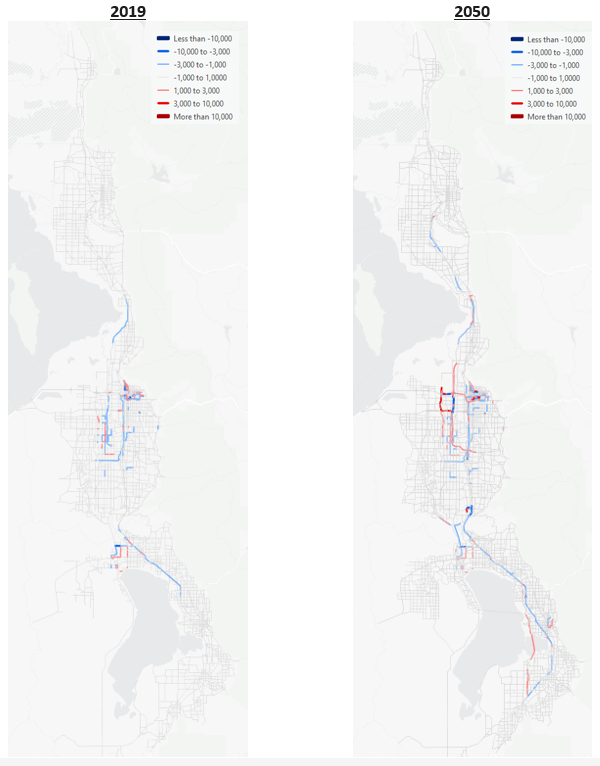
Model Results
Figure 1 and Figure 2 contain a daily total volume comparison and a daily truck volume comparison. Daily total volumes are very similar between the two models. There is a slight shift of volume off of I-15 and onto parallel corridors. The largest volume shifts in 2050 are between I-215 and Bangerter Highway. Figure 1 shows one-way volumes.
Daily truck volumes show more differences with volumes dropping between the two models. The drop in volumes is less than a 1,500 trucks per day on freeways but is widespread throughout the region. Figure 2 shows one-way volumes.