Compare Model Results
This section compares the model results between version 9.0.2 and version 9.0.1-patch2.
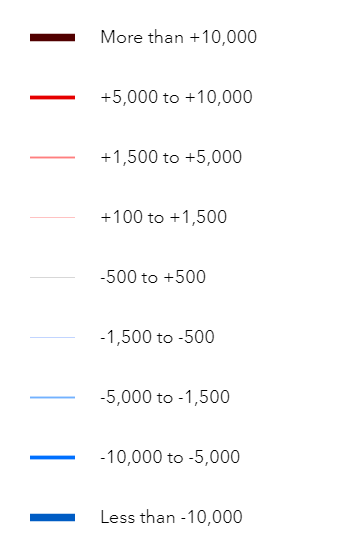
Road Volume Comparisons
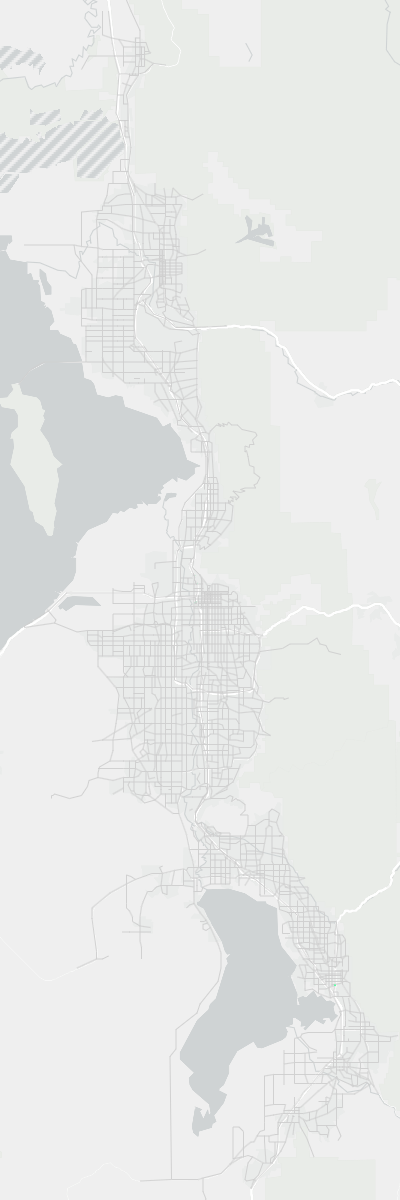
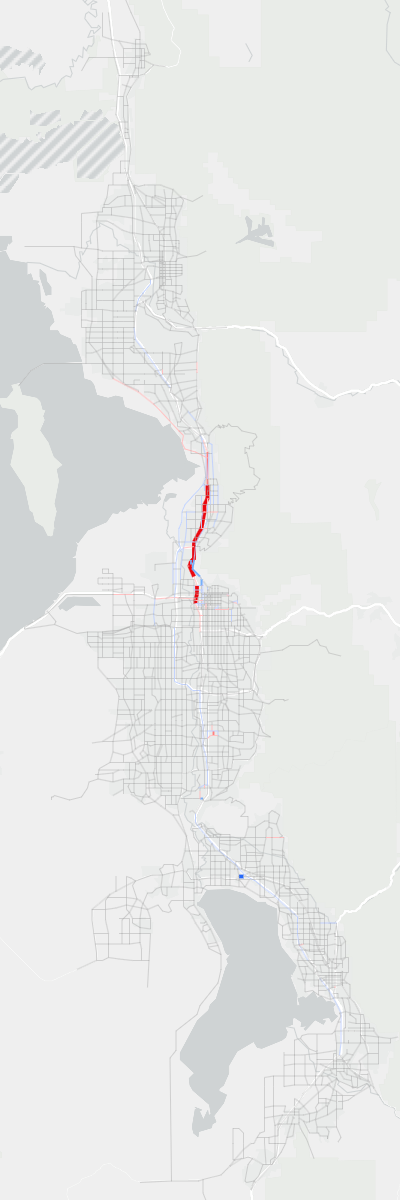
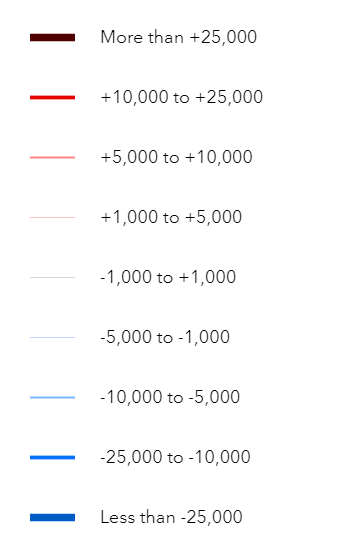
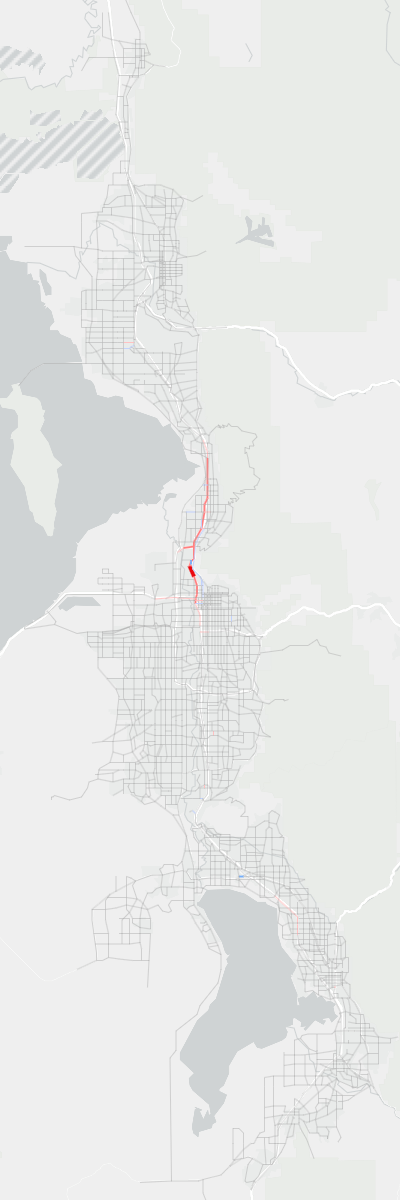
The comparison between daily volumes at the segment level can be found in Figure 1 for 2019 and 2050. Decreases in volume in version 9.0.2 compared to version 9.0.1-patch2 are shown in blue, while increases are shown in red. Figure 2 shows a similar comparison, displaying medium plus heavy truck volumes.
For 2019, the differences are negligible in all vehicle and truck volumes between the model versions.
For 2050, there are increases in both all vehicle and truck volumes on I-15 in Davis County due to increased general purpose capacity. Other differences are negligible.

Transit Comparisons
Version 9.0.2 showed a slight increase in transit trips in 2042 and 2050 compared to version 9.0.1-patch2 (see Figure 3 through Figure 9). The total transit trips in 2050 for version 9.0.2 is 337,000 daily trips compared to the version 9.0.1-patch2 model that showed 320,000 daily trips, which equates to 5% more trips.
Commuter Rail saw the greatest increase in trips, some of which were new trips and some that had shifted from Express Bus to Commuter Rail. The shift from Express Bus to Commuter Rail is primarily due to the improvements in commuter rail speeds and to the additional stop in Bluffdale. These improvements make Commuter Rail more attractive and accessible which draws trips away from Express Bus since they compete for trips in similar markets.
BRT saw a slight increase in future trips. Light Rail, Core Route, and Local Bus trips remained relatively unchanged.