Funds planned for 15 priority projects, including enhancements for pedestrians and…
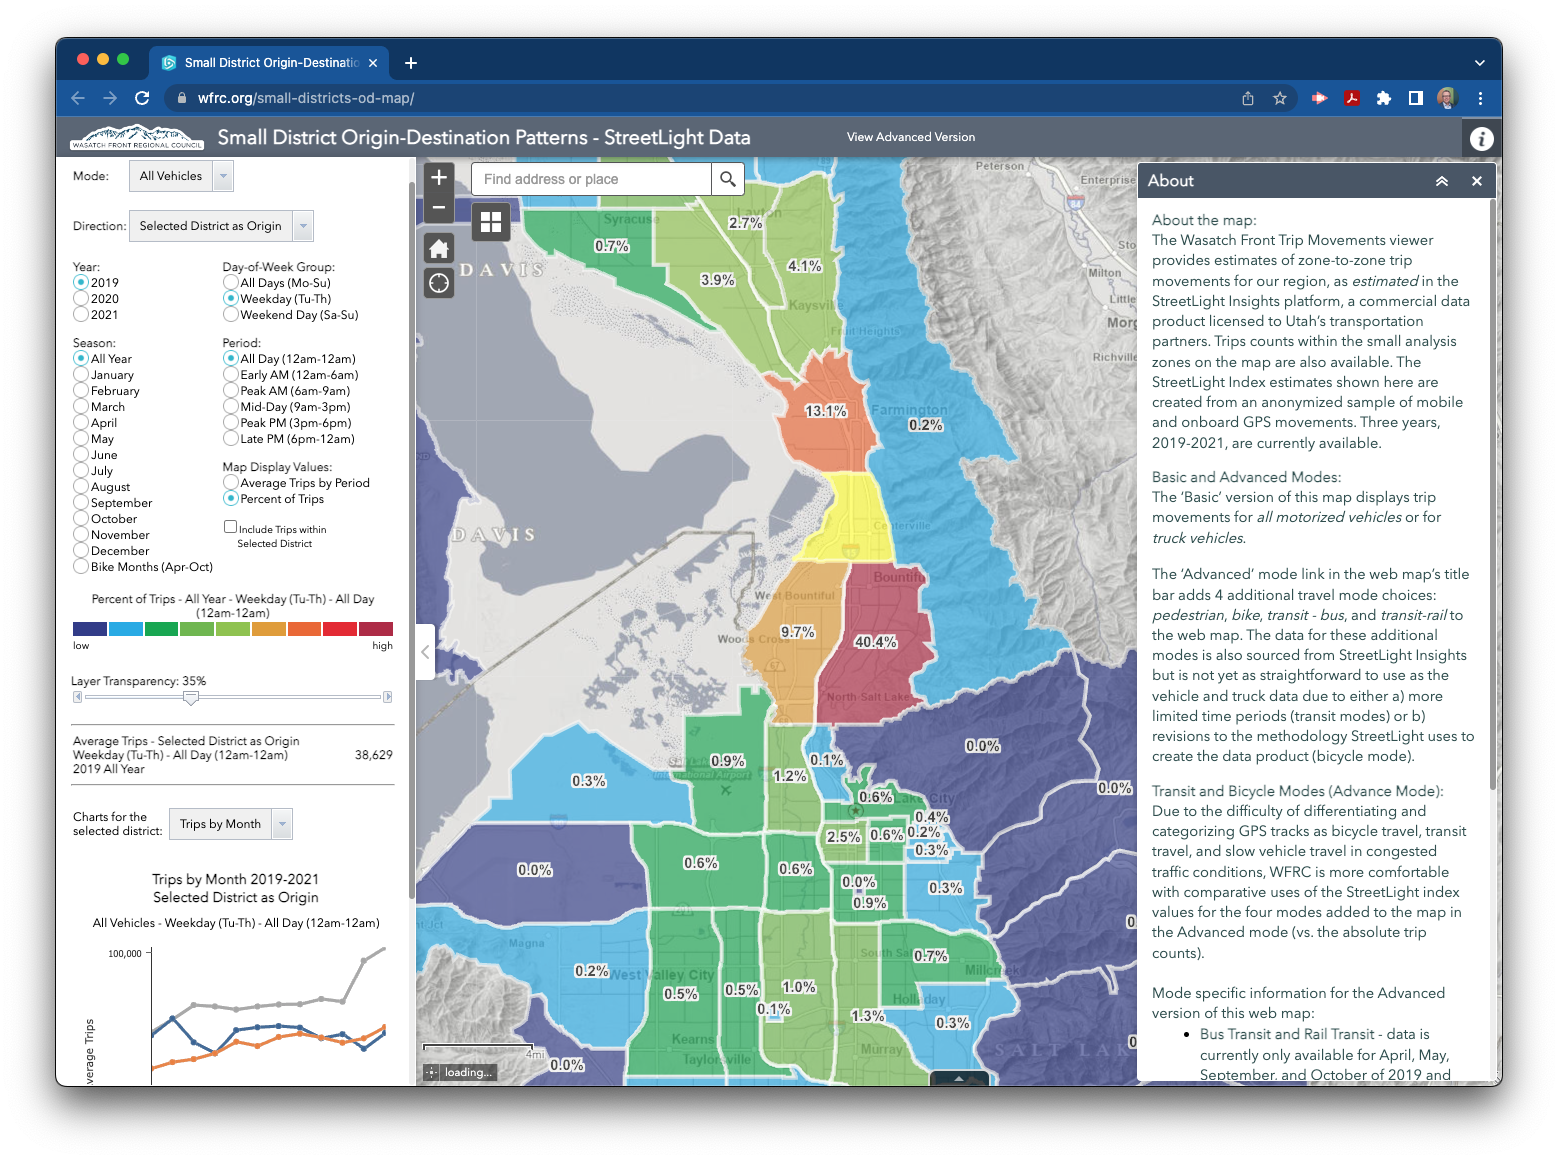
July Map of the Month: “StreetLight Index” Trip Movements
“Where is everybody going?” – this is perhaps the key question for understanding how well our transportation system serves the region today, and for planning for our future.
UDOT, UTA, WFRC and the 3 other Utah MPO’s recently purchased access to a statewide trip movement data product — licensed from a company called StreetLight — that estimates travel between traffic analysis zones from an anonymized sample of mobile and onboard GPS devices.
Our July Map of the Month features “StreetLight Index” trip movements (a.k.a. origin – destination flows) summarized across 123 small areas of the Wasatch Front. By default, the map provides trip information for your choice of StreetLight’s two mainstay travel modes – All Motorized Vehicles or Truck Freight.
With the map, you can get a good feel for the relative amount of travel being made to or from any area of the Wasatch Front, by month and time of day. Where are trips from the University of Utah coming from during the morning commute? Midday? Or the afternoon peak? And, you can graph how the travel volume changes across the past three (interesting) years, or even by weekday or weekend.
Click the link to toggle to the map’s advanced mode, which displays emerging StreetLight trip movement data for bike, pedestrian, bus transit, and rail transit modes. But, as the data for these modes is still maturing, there are a few key caveats that are explained as you make the switch to the advanced mode.
The StreetLight datasets are another great information resource to add to our growing collection of regional travel information. Other tools include: the regional travel model and forecast, UDOT and UTA vehicle and ridership counting systems, commuting patterns gathered by the Census Bureau, and the statewide household travel survey just to name a few.
Related Posts